This is part 2 of a series of blog posts describing Power BI – Microsoft’s Self-Service BI in the cloud initiative. In this post we take a deeper look at how to find the data, the very backbone for the reporting and analysis.
Power Query Primer Power Query is an Excel add-in, and among the range of tools that comprises the editing part of Power BI, it is normally the tool you would start with when creating your shared reports. Its purpose is to make it easy to load data into Excel (either directly into the worksheet or into the underlying data model) from a multitude of external sources, using a unified interface which is easy to learn for everyone who has at least intermediate experience with Excel.
Once you have loaded the data and shaped them the way you want, you can reuse them in multiple workbooks and even share them with other users by making them available in a Power BI site in an Office 365 tenant.
Installing Power Query
Power Query is a new tool and is not installed in Excel by default. This model makes it possible for Microsoft to run frequent updates on Power Query without having to release a new version of Excel all the time. You can download and install power Query from this link: http://bit.ly/1CFMvv3.
After completing the installation you need to add it to Excel. Open the Excel File backstage menu and select Options. Then select Add-Ins in the left menu and in the drop-down at the bottom of the page, select COM Add-Ins and click Go.. In the COM add-Ins dialog, check the Power Query check box and click OK. You are now ready to start using Power Query.
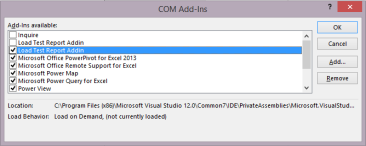
Fig 1. Adding Power Query to Excel
Data Sources
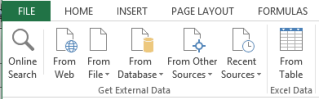
Fig 2: From the toolbar, Power Query provides not only a range of external data sources but also data stored as a table in the local Excel Workbook and online search capabilities into web sources curated by Microsoft.
One of the most powerful features that Power Query provides is the wide range of data sources that it supports. In addition to relational databases and various file formats like .csv , .txt and .xml, it also support various other sources like OData feeds, SharePoint lists, Hadoop (HDFS) files, Active Directory and even Facebook. Another good thing is that the interface used to connect to these different range of sources is almost identical.
Power Query can also query RESTful web services using the From Web button by just entering the URL of the web services. Responses will usually return data in XML or JSON format, and Power Query will recognize the format used automatically. From the user interface only GET requests are supported. Querying POST requests require custom code.
Another great feature is the Online Search capability which actually is the gateway to access 2 different data sources. First it will allow you to query a number of public data sources curated by Microsoft, like Wikipedia, and then, if you own a Power BI for Office 365 subscription, you can search for data that you and your colleagues have shared through a feature called the Data Catalog. The Data Catalog is a repository where query definitions can be stored for reuse by others ( it doesn’t contain the actual data from the query). From Power Query, this repository is available from the “My Data Catalog Queries” button on the Power Query ribbon.
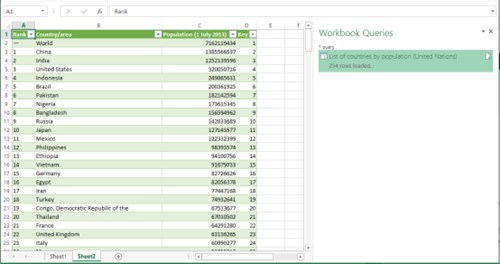
Fig 3. Querying online resources
Transforming Data
When you have collected the data you need from your source, you will most likely want to change it or clean it before you load it into the worksheet or the Excel Data model. Most often there are things in the you need to change and Power Query comes in handy here too.
One of the first things you will want to do is to make sure your columns are in the right place, are named appropriately, and are using the correct data types. When you have fixed those, you may want to for example split a column into 2 if for example address and zip code are in the same one. You can also go the opposite way, by merging 2 columns into one. Other standard functions you can do with columns are filtering and sorting. You can for instance filter out rows that are empty or contain errors.
Unpivoting Columns to Rows
Pivoted data can come in handy when you read a report, but loading pivoted data into a data model with aggregated data is not always what you want. In many circumstances it’s much more convenient to have a single column for your sales values and one row for each year. By selecting the pivoted columns and clicking the Unpivot button the columns will be split into one row for each year or time period.
Where to Put Your Data
When you have finished working with your data in the Power Query Editor, you can choose to load it in either the Excel Worksheet itself or into the Excel Data Model. Loading to the worksheet will result in the output of your query being loaded to a table in the worksheet. Loading to the model will result in the output being loaded to a table in the Excel Data Model. This model is an in-memory database which is a new feature in Excel 2013, and it is the database engine behind Power Pivot. In the data model view there are lots of things you can do with the data, like fixing missing relationships and integrating tables from the Power Query results, plus it’s the fundament for creating effective and interactive visualizations with tools like Power View and Power Map. We will go deeper into Power Pivot and the Excel Data Model in part 3.
The M Language
If you want to utilize the full potential of Power Query, you need to learn Power Query’s Formula language , M. For each step you do with the data , Power Query will generate equivalent M code lines. M is not like Excel Formulas or Visual Basic for Applications (VBA) syntax, it’s a functional language and therefore has mote in common with eg. F#.

M comes with a large number of built-in functions called the Standard Library. You can declare variables, add comments, add conditional logic with if statements, work with data in lists and tables, create recursive functions and call web services.
We will revisit the M language in a future blog post, going a lot more into structure and coding details. Although you will seldom need to use M because the user interface does almost everything you need, learning how the expressions are created and written is a valuable source to understanding how Power Query works.
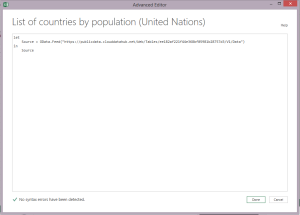
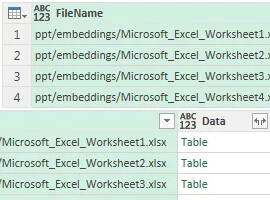
Fig 4. Advanced Editor displaying the M code generated from creating the query in the image above.
Merging Queries
Merging queries is a crucial feature when it comes to finding relationships and being able to analyze the data properly. Merging queries means joining two queries together, much like a join in SQL. You can merge queries both in the user interface or by using M functions.
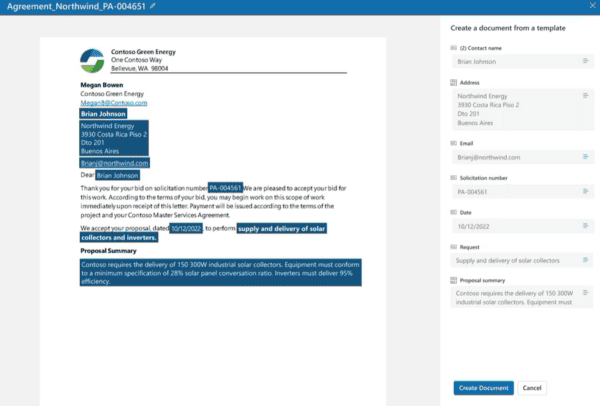
Merging is typically done using different data sources and the idea is to find a common value in 2 or more columns in each table, typically a number that never changes for each row.
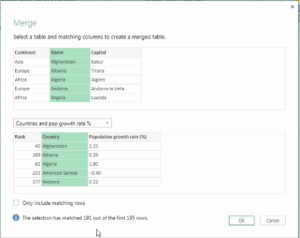
Fig 5. Merging 2 tables based on common column data.
Summary
Power Query is a new and powerful tool, and like many other tools under the Office 365 umbrella, it’s being constantly updated. In order to keep yourself informed I would recommend that you take a look at the Power BI team blog page at http://blogs.msdn.com/b/powerbi/ . The latest changes were announced on 25th Nov and includes connectors to SQL Server Analysis Services, new File Meny options in the Query editor and a new connector for Salesforce Reports & Objects.
If you are interested in a more “visual” introduction to Power BI and Power Query, I would recommend the Power BI Jump Start course at Microsoft Virtual Academy: http://bit.ly/12nxXiY
In the next post I will be deep-diving into Power Pivot and the Excel Data Model. Understanding how the Excel Data Model works is important in order to make full use of the power BI visualization tools like Power View, Power Map and Q & A. See you soon!
If you have a question for Bjoern please leave a comment below. This blog was first published by Bjoern Rapp here. For more educational content on BI why not check out Rafal Lukawieck’s ESPC14 conference keynote presentation on Attractive & Collaborative Business Intelligence with Microsoft Power BI and SharePoint. Download the BI presentation now>>
About Bjoern:
Hello, I’m Bjoern H Rapp. I have been working with SharePoint mainly as a developer and architect since 2009, but my programming career goes as far back as 1999 working with languages and tools like Java, C++, .NET and Oracle. I’m also a former Air Force officer.

Bjoern H Rapp
Currently I work for Steria AS in Oslo, a small but highly competitive consulting house focusing on delivering solutions based on SharePoint (including O365) and MS Dynamics CRM. My focus is on development and creating business value for my customers. I love working with apps in SharePoint 2013 and I also regard myself a specialist in the workflow department. I also love working with jQuery and all the new features that HTML5 provides.
I’m an active SharePoint Community player. Last year I received the Microsoft Community Contributor Award (MCC) for supporting the SharePoing Community on the MSDN Forums and Technet. I’m also a moderator on the MSDN SharePoint forums and I have written a number of technical articles for Technet. In February 2013 I was awarded the top Norwegian SharePoint influencer at the European SharePoint Conference.