In this post, I’m showing how to connect Windows servers to Azure Sentinel, install Sysmon, how to parse those events, and what to do with them.
After all, Sentinel is a cloud-native SIEM, but luckily, it’s not cloud-only.
Setting up Azure Sentinel
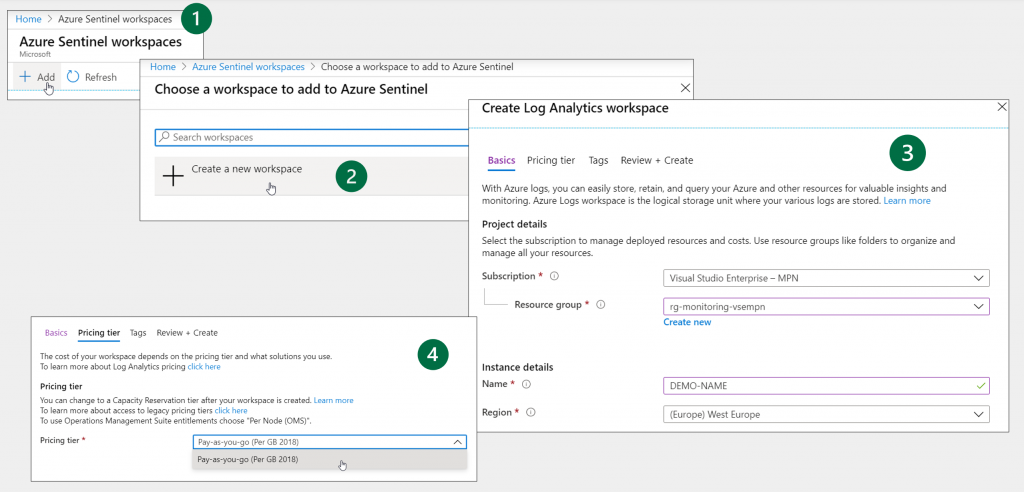
This step is quite simple. Sentinel is basically just a solution that builts on top of Log Analytics, so that’s what we actually create here.
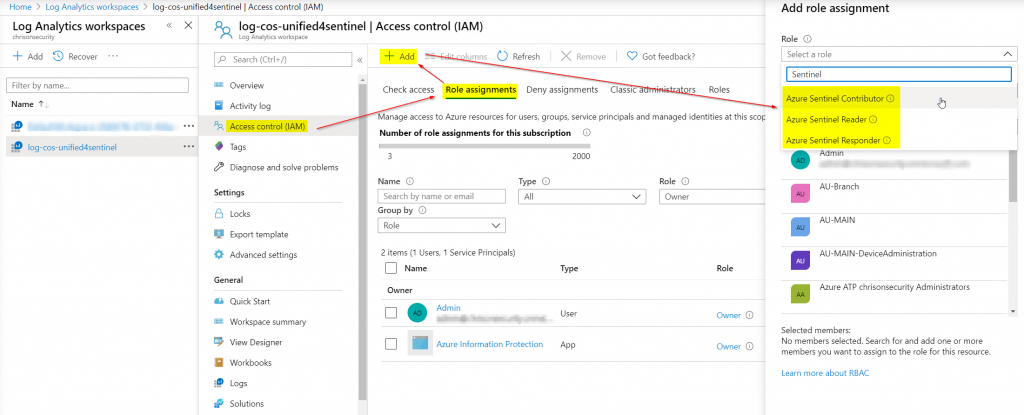
Keep in mind that there might be very sensitive data residing inside Log Analytics / Sentinel, so only specific people should have access.
If you want to grant permissions to additional principals, there are three default roles:
- Azure Sentinel Contributor
- Azure Sentinel Reader
- Azure Sentinel Responder
| Role | Create and run playbooks | Create and edit dashboards, analytic rules, and other Azure Sentinel resources | Manage incidents (dismiss, assign, etc.) | View data, incidents, dashboards and other Azure Sentinel resources |
|---|---|---|---|---|
| Azure Sentinel reader | — | — | — | X |
| Azure Sentinel responder | — | — | X | X |
| Azure Sentinel contributor | — | X | X | X |
| Azure Sentinel contributor + Logic App contributor | X | X | X | X |
Reference: https://docs.microsoft.com/en-us/azure/sentinel/roles
Log Analytics has its own roles that should also be reviewed for least privilege: https://docs.microsoft.com/en-us/azure/role-based-access-control/built-in-roles#analytics
Connect systems to Sentinel
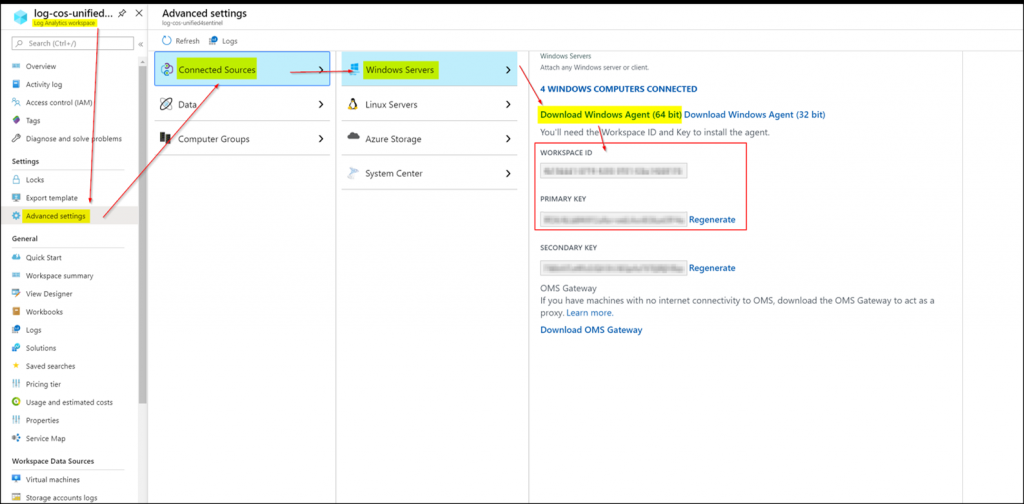
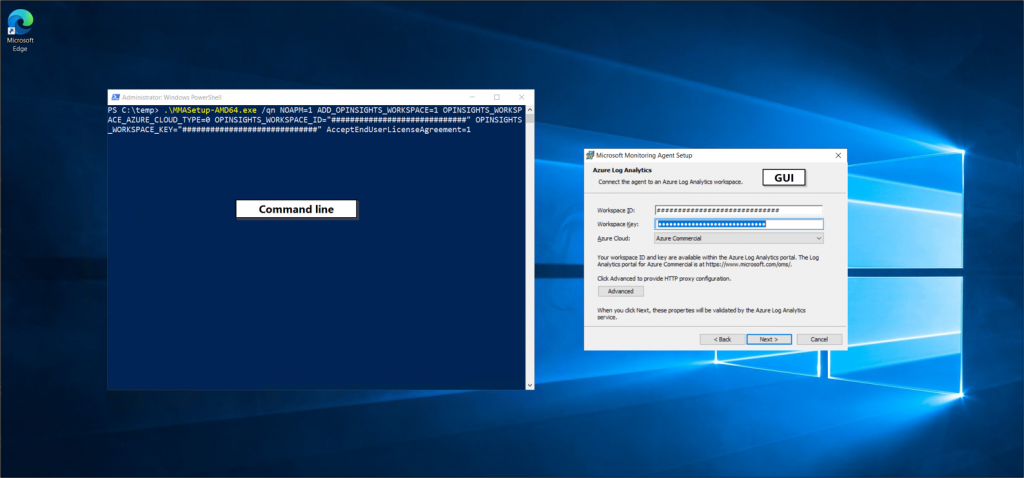
Connecting servers to Sentinel occurs via Log Analytics which is the technical basis for data storage. On the server side we need the Microsoft Monitoring Agent (MMA) together with the workspace ID and its key:
The MMA can be installed using the wizard or command line which is of course useful for bulk enrollment.
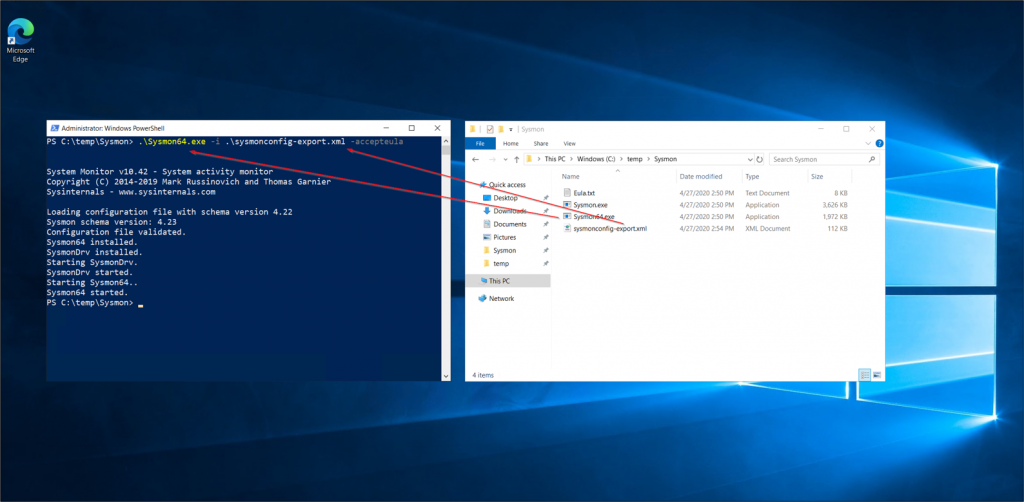
Next, we need to install Sysmon which can be downloaded directly from Microsoft: https://docs.microsoft.com/en-us/sysinternals/downloads/sysmon
It already provides some basic functionality but can be further enhanced by (custom) config files that can be set during the installation process. A good starting point is the one by SwiftOnSecurity: https://github.com/SwiftOnSecurity/sysmon-config
There are several forks of it, so depending on your needs there might be an even better option.
Configure Sysmon log collection
Now we also need to tell the Log Analytics workspace to collect those Sysmon events. This can be done like you see here:
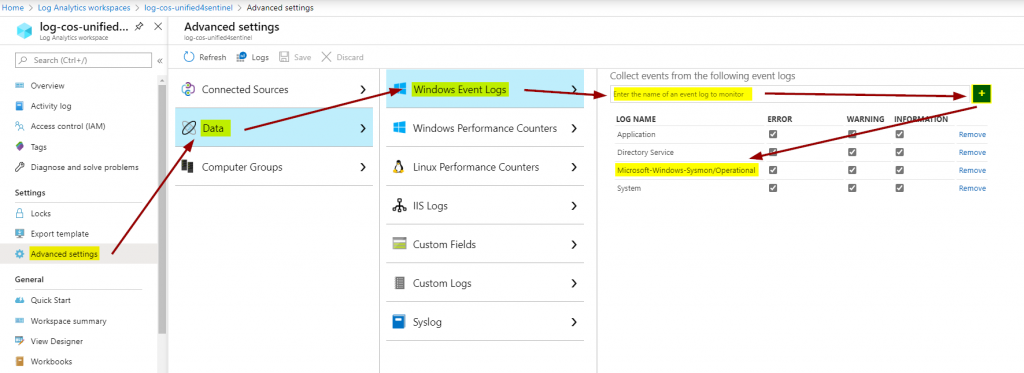
This will tell the Microsoft Monitoring Agent on the server(s) to also collect and send Sysmon events. This is the great part about the MMA: you hardly have to touch the local system for configuration changes but can rely on the cloud dashboard.
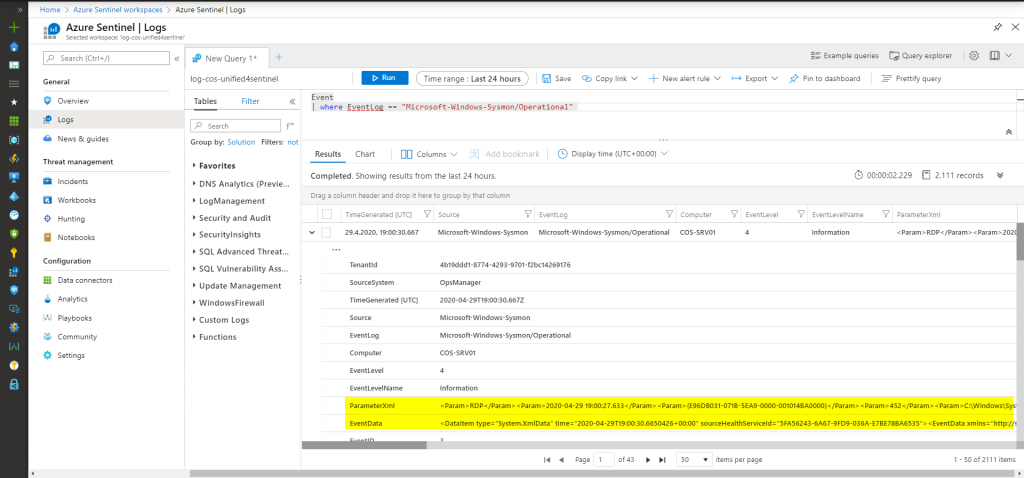
Parse events
Now we can head over to the raw log data that is sent to the workspace. You might notice that not all information is available right away in the form of columns. Instead, the real important data is stored inside of the two colums “ParameterXml” and “EventData”:

Here’s another good one from BlueTeamLabs: https://github.com/BlueTeamLabs/sentinel-attack/tree/master/parsers
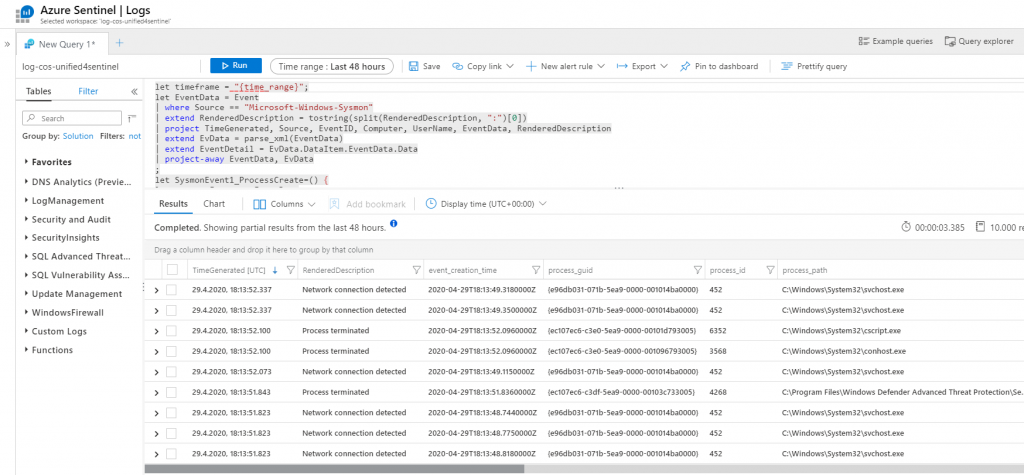
Now you take the whole query and enter it in the query field in Sentinel / Log Analytics. This parses all relevant information into different columns that can be evaluated more easily.
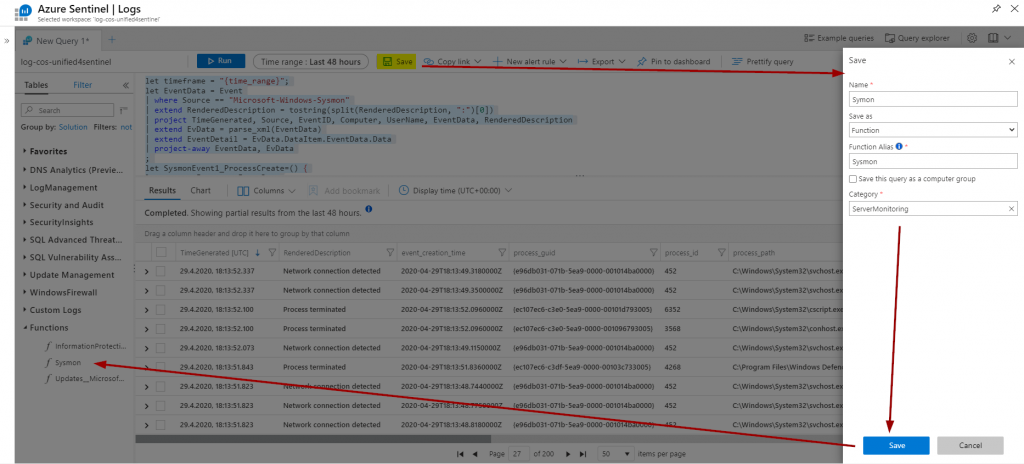
You can also save this query as a function which significantly reduces the trouble of pasting the parsing query over and over again:
Analytics and visualization
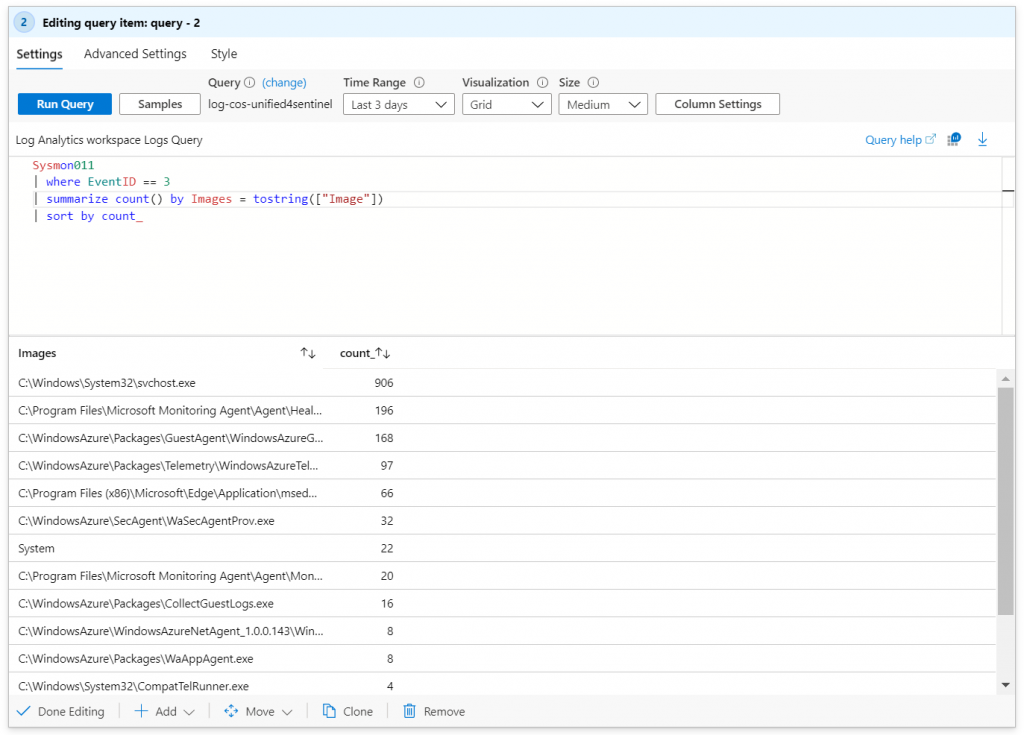
Now that we have the data, we can start filtering and build Sentinel workbooks for graphical overviews. As always, I’m not that creative when it comes to fancy visualization options, so here’s just a quick example counting what binaries established network connections:
Sysmon011
| where EventID == 3
| summarize count() by Images = tostring(["Image"])
| sort by count_
Note
Sysmon011 is the function that represents the Sysmon parsing query.
Of course you can do much more with all the Sysmon events but that will very likely depend on your use cases and what you want to monitor.
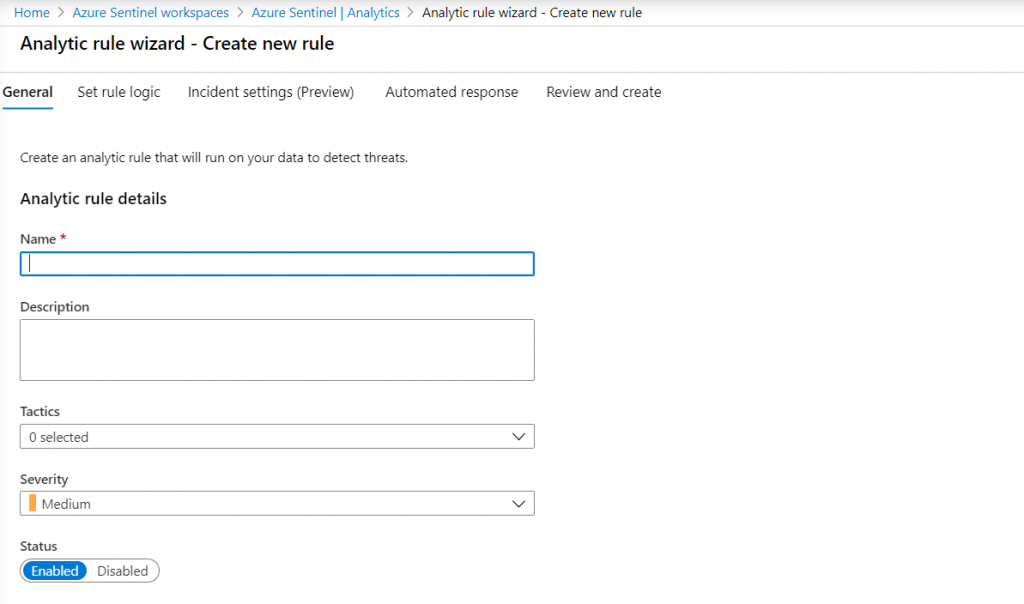
Don’t forget that you can now also head over to AS Analytics to create alerts / incidents and automated actions based on the data:
Summing things up
Using Sentinel and Sysmon together is a great example that illustrates the versatility of Sentinel. “Cloud-native SIEM” does not mean “cloud-only”, so nearly everyone working with Microsoft tools can use it to collect and evaluate data.
Thanks for reading!
Chris
About the Author:
Christian Müller is working at German Microsoft partner infoWAN as a Security Consultant. He focuses on securing Microsoft 365, Microsoft Azure and Active Directory. Besides blogging, he also speaks at community events.
Reference:
Müller, C. (2020). Azure Sentinel – Monitor Servers using Sysmon. Available at: https://chrisonsecurity.net/2020/05/05/azure-sentinel-monitor-servers-using-sysmon/ [Accessed: 19th May 2020].
Check out more great Azure content here