It is always the same. After people get in touch with SharePoint and start working with document libraries, custom lists or some of the provided lists (like Tasklist) they like the way to share and to see their data like a dashboard. And the next question is about conditional formatting of columns, rows or displaying a percentage bar, displaying some values in red, blue, green, yellow or pink. Ok, pink is not true. But true is: people love dashboards and KPIs, which make list of data more easily to read and understand. Those colors are setting a certain focus on important data or just remind us that we have some to-do’s – it’s a kind of magical visualization of data.
In SharePoint 2010, we were able to do some coloring at our list views by using the SharePoint Designer 2010 – It offers a ribbon button to define via User Interface what should happen if a certain condition comes true or not.
With SharePoint 2013 and the new version of SharePoint Designer 2013 this functionality is gone. Really gone? No, it can be done by using a different way. The different way is called client-side rendering (CSR) or sometimes you’ll find some word like JSLink. JSLink is a new property in the webparts for listviews and some more webparts.
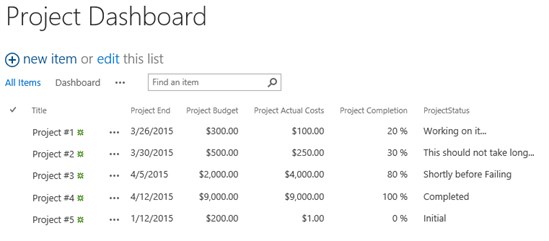
How could it look like? Well, let’s assume that we have an easy project list and just want to add some color styles based on the values like this screen:
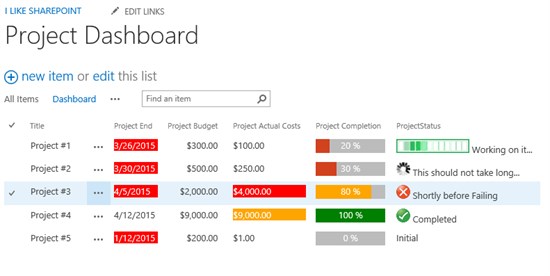
As you can see, we have a Project End Date, we have a budget, actual cost, a completion in percent and a project status. In this example, we like to have red background if the project end date is less than today and red background if the actual costs are higher than the budget. If budget and costs are the same, it should be orange. In the completion field we would like to have a bar which displays the completion rate in percent and it should have different bar colors (yellow if more than 50% and green if it’s over 90%). Depending on the status, it should show different images or gif animations.
How can we do such a dashboard? Well, you don’t have a User Interface but you create a javascript file and store this file somewhere in your site collection. The link to the Javascript file you have to put it into the JSLink property of the webpart. That’s the short story, sounds really simple somehow, but the details are important.
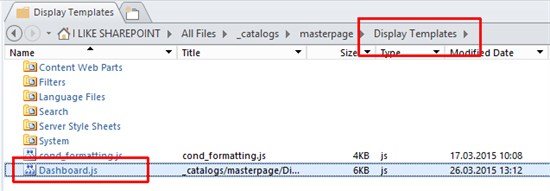
Ok, let’s start creating a Javascript file. I open SharePoint Designer and go to All Files -> _catalogs -> masterpage -> Display Templates. There I create a new file via the ribbon interface and call it Dashboard.js. You can put it also in a document library if you like or if you don’t have SharePoint Designer for any reasons.
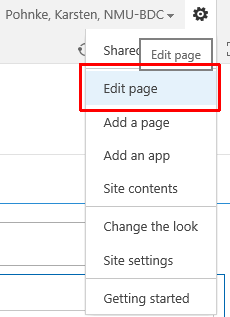
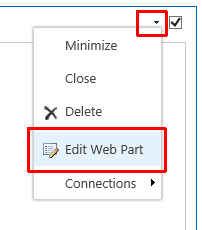
In order to call this Javascript file at the list view, you have to open the desired list view and click on Site Settings and the Edit page
After that you can open the Webpart properties menu by clicking on the Edit Web Part Button.
There you’ll find the JS Link property below Miscellaneous where you can insert this link:
~site/_catalogs/masterpage/Display Templates/dashboard.js

Click OK and stop editing the page. Now it’s time to do some coding.
In the coding we have to think about a feature in SharePoint which could be activated. It is called the Minimal Download Strategy (MDS). This feature is activated by default and transfers only the delta changes between server and client. It contains something like a garbage collector which removes some global variables in Javascript. Because of this we will build a construct, which checks if this MDS-feature is activated and we operate by using a namespace. If you don’t pay attention to this, you only see your conditional formatting after hitting STRG+F5 – because otherwise it won’t load the changes and your listview will be like the standard:
So at first we have to define our Namespace and functions and templates area.
Type.registerNamespace(‘ILS’)
ILS.Demos = ILS.Demos || {};
ILS.Demos.Templates = ILS.Demos.Templates || {};
ILS.Demos.Functions = ILS.Demos.Functions || {};
//* Block for Functions
*//
Then we normally have to define the functions. I suggest, you create a block where you can put those functions into at a later time. But let me explain the steps, and afterword we can order it right.
At the beginning, we check if _spPageContextInfo is available. If it’s available, we know that the MDS Feature is activated. In this case we call a different function as we would do as if it’s not activated.
//Starting
//If _spPageContextInfo is available the MDS is activated, we have to register our function
if (typeof _spPageContextInfo != “undefined” && _spPageContextInfo != null) {
ILS.Demos.Functions.MdsRegisterField();
}
else
{
//MDS is not activated, we register our Functions
ILS.Demos.Functions.RegisterField();
}
Those two functions are doing almost the same. The MDS RegisterField-Function calls the RegisterField function but it also calls a RegisterModuleInit function, to get it working with MDS.
ILS.Demos.Functions.RegisterField = function () {
SPClientTemplates.TemplateManager.RegisterTemplateOverrides(ILS.Demos)
}
ILS.Demos.Functions.MdsRegisterField = function () {
var thisUrl = _spPageContextInfo.siteServerRelativeUrl
+ “/_catalogs/masterpage/Display Templates/Dashboard.js”;
ILS.Demos.Functions.RegisterField();
//That’s an important step when MDS is active
RegisterModuleInit(thisUrl, ILS.Demos.Functions.RegisterField)
};
In the next step we define the fields in which we would like to create conditional formatting. The structure is always the same:
“InternalFieldName” : {“View”: FunctionNameToCall}
The parameter “View” defines, where the function should take effect. You can also define DisplayForm, etc. But that would not make sense in a list view.
ILS.Demos.Templates.Fields = {
“ProjectEnd”: {“View”: ILS.Demos.Functions.ProjectEnd },
“Project_x0020_Actual_x0020_Costs”: {“View”: ILS.Demos.Functions.ProjectCosts },
“Project_x0020_Completion”: {“View”: ILS.Demos.Functions.ProjectCompletion },
“ProjectStatus”: {“View”: ILS.Demos.Functions.ProjectStatus }
};
Well, now we have 4 fields and we have 4 javascript functions to call. Let’s start with the first one. We create a function which gets the parameter ctx as context. That means, that we can call the context information like ctx.CurrentItem.FieldName in order to get the value of this column. In each function we have to return a value for the column. This return value will also define how the column will be rendered. So you will see, that we return a mix of html, css and the value itself.
Function 1: Project End
In this function we compare the date value of the column with the date of today, but we only compare date without the time.

{
//Convert the CreateDate into a number with getTime()
//ATTENTION: We Split by using ‘/’ if you turn to another language setting it might not working!
var ProjectEnd = new Date(ctx.CurrentItem.ProjectEnd.split(‘/’)[2],ctx.CurrentItem.ProjectEnd.split(‘/’)[0]-1,ctx.CurrentItem.ProjectEnd.split(‘/’)[1]).getTime();
var today = new Date();
today.setHours(0,0,0,0);
var todayNo = today.getTime();
//Compare and react
if(ProjectEnd == ‘undefined’ || !ProjectEnd)
{
return ctx.CurrentItem.ProjectEnd;
}
else if(ProjectEnd < todayNo)
{
return “<span><font style=’background-color:red;display:block;color:#fff;’>”+ctx.CurrentItem.ProjectEnd+”</font></span>”;
}
else if(ProjectEnd == todayNo)
{
return “<span><font style=’background-color:yellow;display:block;’>”+ctx.CurrentItem.ProjectEnd+”</font></span>”;
}
else
{
return ctx.CurrentItem.ProjectEnd;
}
}
On the behalf of the condition we return the value rounded from html and css which makes the background red and the color white in this case.
<span><font style=’background-color:red;display:block;color:#fff;’>”+ctx.CurrentItem.ProjectEnd+”</font></span>
The result will be like this:

Function 2: Project Status
In this function we compare simply strings and based on the condition we return the column value and also an image which is stored in the _layouts folder, but the images could also be in a site collection library.
ILS.Demos.Functions.ProjectStatus = function(ctx)
{
var ProjectStatusValue = ctx.CurrentItem.ProjectStatus;
var returnvalue = ProjectStatusValue;
if(ProjectStatusValue == ‘Completed’)
{
returnvalue = “<span><img src=’//www.sharepointeurope.com/_layouts/images/kpinormallarge-0.gif’ width=’20px’ height=’20px’style=’border:0px;’> “+ProjectStatusValue+” </span>”;
}
else if(ProjectStatusValue == ‘Working on it…’)
{
returnvalue = “<span><img src=’//www.sharepointeurope.com/_layouts/images/kpiprogressbar.gif’ height=’20px’style=’border:0px;’> “+ProjectStatusValue+”</span>”;
}
else if(ProjectStatusValue == ‘Shortly before Failing’)
{
returnvalue = “<span><img src=’//www.sharepointeurope.com/_layouts/images/kpinormallarge-2.gif’ width=’20px’ height=’20px’style=’border:0px;’> “+ProjectStatusValue+”</span>”;
}
else if(ProjectStatusValue == ‘This should not take long…’)
{
returnvalue = “<span><img src=’//www.sharepointeurope.com/_layouts/images/loading16.gif’ width=’20px’ height=’20px’style=’border:0px;’> “+ProjectStatusValue+”</span>”;
}
else if(ProjectStatusValue == ‘Completed’)
{
returnvalue = ctx.CurrentItem.ProjectStatus;
}
return returnvalue
}
This is the expected result:

Function 3: Project Completion
In this function we use a little bit more css, because we would like to get the progress bar based on the value. At first we define a div as background (grey) and on the top of the background we create another div which has an overlayed color like red or green and the text color will be white. Because the value will be something like “100 %” we split this string to get only the number of this value and put this into the css-width setting of the last div.
ILS.Demos.Functions.ProjectCompletion = function(ctx)
{
var returnvalue = ‘<div style=”background: #BCBCBC; display:block; height: 20px; width: 100px;”><span style=”color: #fff; position:absolute; text-align: center; width: 100px;”>’+ctx.CurrentItem.Project_x0020_Completion+'</span><div style=”background: #D2421F; height: 100%; width: ‘+ctx.CurrentItem.Project_x0020_Completion.replace(” %”, “”)+’%”></div></div>’;
var completion = ctx.CurrentItem.Project_x0020_Completion.split(‘ ‘)[0];
if(completion > 50)
{
returnvalue = ‘<div style=”background: #BCBCBC; display:block; height: 20px; width: 100px;”><span style=”color: #fff; position:absolute; text-align: center; width: 100px;”>’+ctx.CurrentItem.Project_x0020_Completion+'</span><div style=”background: orange; height: 100%; width: ‘+ctx.CurrentItem.Project_x0020_Completion.replace(” %”, “”)+’%”></div></div>’;
}
if(completion > 80)
{
returnvalue = ‘<div style=”background: #BCBCBC; display:block; height: 20px; width: 100px;”><span style=”color: #fff; position:absolute; text-align: center; width: 100px;”>’+ctx.CurrentItem.Project_x0020_Completion+'</span><div style=”background: green; height: 100%; width: ‘+ctx.CurrentItem.Project_x0020_Completion.replace(” %”, “”)+’%”></div></div>’;
}
return returnvalue;
}
The percent bar will look like this:

Function 4: Project Costs
One of the coolest things is, that you can get everything you like out of the context. In this example you see that we fetch the values of the actual costs and of the budget. So we compare two different field values with each other and based on the condition we return our colorful value. The interesting part is, that those field values are defined as currency fields, so they look like “200 $” but they are comparable without transforming the values into numbers or something like that.
ILS.Demos.Functions.ProjectCosts = function(ctx)
{
var costs = ctx.CurrentItem.Project_x0020_Actual_x0020_Costs;
var budget = ctx.CurrentItem.ProjectBudget;
if(costs > budget)
{
return “<span><font style=’background-color:red;display:block;color:#fff;’>”+costs+”</font></span>”;
}
else if(costs == budget)
{
return “<span><font style=’background-color:orange;display:block;color:#fff;’>”+costs+”</font></span>”;
}
else
{
return costs;
}
}
Our Project costs will be formatted like this:

At the end, you just click on save and refresh your list view in which you put the JSLink property. You can also use Powershell or C# to insert the JSLink in a lot of Views, if your list already exists with many views.
Those 4 functions you should put into the block we defined at the very first beginning of coding. Please ensure that you have the following ordering in your Javascript:
- Namespace and the preparation for the Templates and functions
- Functions 1-4
- Field definitions and the starting with _spPageContextInfo
You can download this example at ilikesharepoint.de
If everything worked well, you’ll see a wonderful colorful dashboard made by yourself. Now you can be creative and create your own list view dashboard and impress your boss. I recommend you to check out these functionalities with JSLink to work inside an item form, for example the NewForm of a SharePoint list item. You can do some customization there like validation, calculation, cascading lookups, etc.
These JSLink option will work in Office365 and OnPremise version and you can use it, without the need of a deployment in your SharePoint Farm, because it is working on the Client side.

 About the author: Karsten Pohnke is Consultant for SharePoint Solutions at arvato Systems with a focus on collaboration, communication and business processes. He provides his customers applications based on standard features as well as development or combining the power of several Microsoft tools like Dynamics CRM. In his free time he tries to collect tips and worthy experience in his blog www.ilikesharepoint.de. Follow him on twitter @kpohnke