If you’ve never worked with flowcharts before, you’re in for a pleasant surprise. Flowchart diagrams aren’t just a great way to systematically map out and manage workflows and tasks, they make all kinds of complicated processes easier to view and understand.
In this article, we’re going to discover how you can use a flowchart maker like MindManager to make any project run smoother.
What is a flowchart?
A flowchart is a visual representation of the distinct steps in a workflow or process.
By connecting those steps sequentially as a series of text-filled symbols or shapes, flowcharts show you:
- Which direction a chain of events flows
- What tasks get completed as part of a particular process
- Where decisions need to be made, and what happens next
Flowcharts make it easier for teams to follow work processes from one end to the other. And that makes them a powerful alignment tool when you need to create, document, analyze, or improve on the way work gets done.
How to use a flowchart
Because they let you plot work paths visually, you can use a flowchart template to solidify personal or team objectives across various business activities. They’re often the tool of choice, in fact, for explaining complex procedures without the technical jargon.
Here are a few flowchart examples outlining areas where these step-by-step diagrams come in especially handy:
- Project management and planning. Heading up a project? You’ll find flowcharts an invaluable aid – especially during the planning stage. Use your diagram to ease collaboration between individuals or departments as you map out the steps your team needs to take.
- Program, product, or system design. Designing a new way of doing something comes with a unique set of challenges. Using a flowchart diagram can help level the playing field when your group is venturing through uncharted territory together – like when you’re tasked with creating a great user experience design, for example.
- Workflow documentation. Documenting a workflow or process with the help of a flowchart maker gives you a visual, readily available point of reference any time you need to get inspired, discuss a problem, make improvements, demonstrate compliance, or share knowledge with a new hire.
- Process audit and decision-making. Trouble-shooting, cost-cutting, and efficiency initiatives are all made easier by using flowcharts to study your options. Decision flowcharts (aka decision tree diagrams) are just one example of how you can review failed or inadequate processes from different angles.
MindManager flowcharts come in a range of shapes and sizes – from process maps to swim lane diagrams. So whether you need to highlight and explore workflow hiccups, or identify opportunities for ramping up output, it’s easy to create the diagram you need.
How to create a flowchart diagram
Since the point of any flowchart is to clarify a process or flow of events, standardized symbols are the key to communicating in a “language” everyone will understand.
The 3 most basic flowchart symbols include:
- Oval shapes (indicate workflow start or end points)
- Rectangle shapes (indicate individual steps)
- Diamond shapes (indicate decision points)
Here’s how to create a flowchart diagram in 4 easy steps.
Step #1:
Establish the purpose of your flowchart and list out the various steps you’ll need to include.
Step #2:
Use a labeled oval shape to represent the starting position of your process or workflow. Then, with the list you just created in hand, start at your oval and use arrowed lines to link the individual steps or tasks in the proper sequence. These steps should by represented by rectangles with brief, text-based descriptions inside.
Step #3:
Use diamond shapes to indicate where decisions will be required in your process – and arrowed lines to link each diamond to new or repeated steps resulting from your decisions.
Step #4:
Use a labeled oval shape to represent the end of your process or workflow.
And that’s it!
It’s worth noting that MindManager makes it easy to add, delete, edit, and rearrange your flowchart template as you go. You can also attach external data, notes, documents, and links to other maps and diagrams to flesh out your process as needed.
Example of a flowchart diagram
No matter how you use it, you’ll find a flowchart diagram equally effective whether it’s driving or supporting your initiative.
Here’s a very simple example.
Let’s say you and a friend want to create, stock, and sell originally designed t-shirts. Neither of you has run a business before, however, so you’re having trouble visualizing what the customer order process will look like.
Since you need to finalize this last part of your business plan before your bank loan appointment tomorrow, your friend suggests using a flowchart diagram to get a handle on your sales order workflow.
You start by listing the series of steps you expect to take as part of this process.
- Your customer places an order
- You pick the requested shirts from your inventory and set them aside
- You process your customer’s payment
- You package and ship their order
- Receipt of their delivery is confirmed
- You follow up to make sure your customer is satisfied
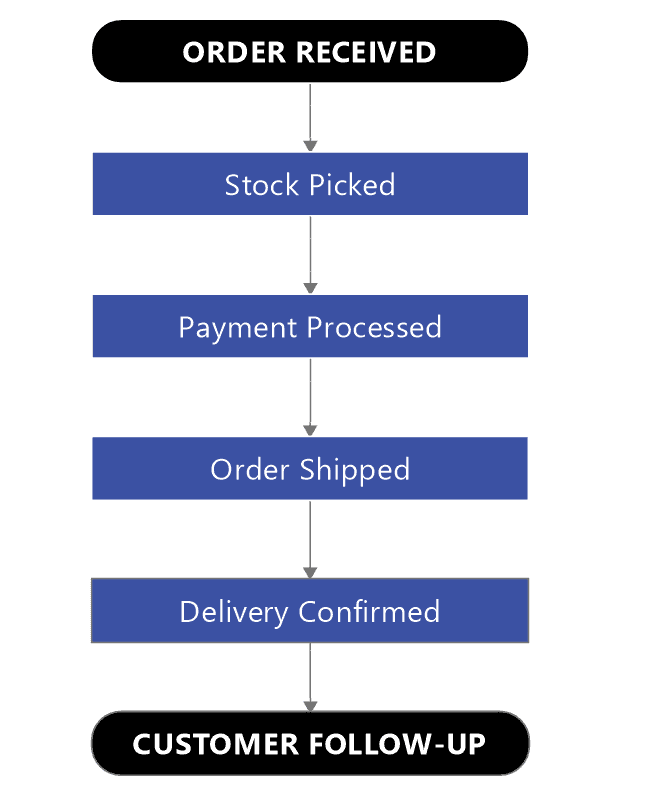
Next, using directional arrows and the appropriate flowchart symbols (in this case, ovals and rectangles), you lay these steps out in your diagram.
ORDER RECEIVED (process start point) > Stock picked > Payment processed > Order shipped > Delivery confirmed > CUSTOMER FOLLOW-UP (process end point)
So far, so good. Here is what your simple flowchart would look like:
You’re smart enough to realize, however, that t-shirt inventory levels are going to fluctuate, and not every customer payment transaction is going to clear.
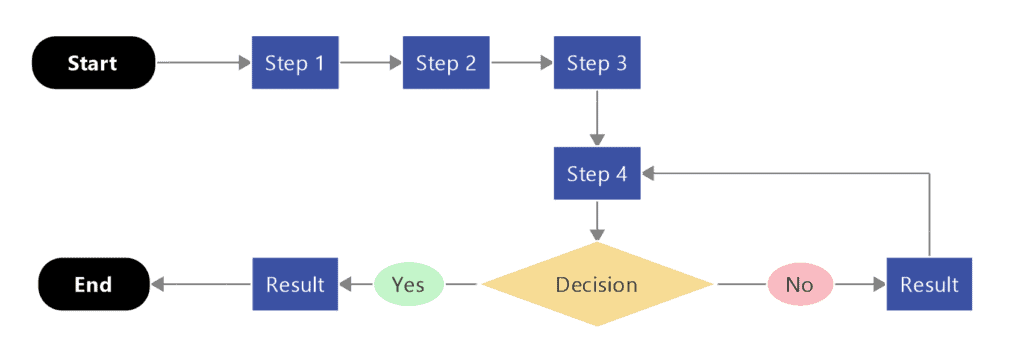
So, you identify where decisions will need to be made, and use diamond shapes to edit and restructure your flowchart at two distinct points.
Point #1

YES > Stock picked > Payment processed …
NO > Additional inventory created > Product in stock?
YES > Stock picked > Payment processed …
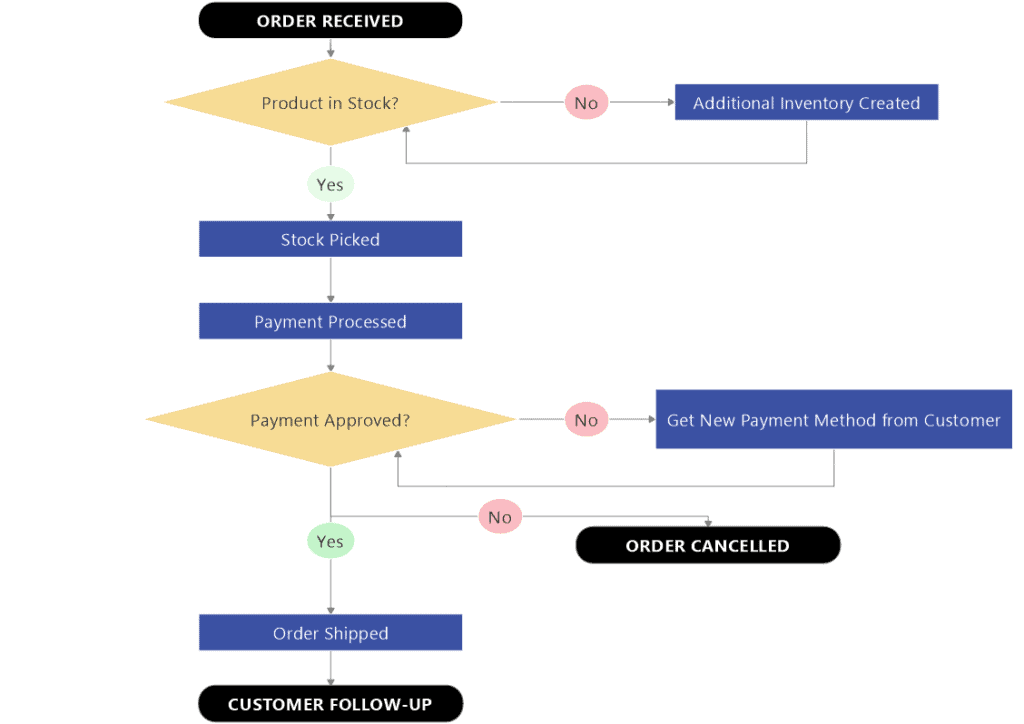
Point #2
ORDER RECEIVED (process start point) > Stock picked > Payment processed > Payment approved?
YES > Order shipped …
NO > Get new payment method from customer > Payment processed > Payment approved?
YES > Order shipped …
NO > ORDER CANCELLED (new process end point)
To design this process as clearly as possible for the benefit of both yourselves and the bank, you label the arrowed lines branching off from your diamonds with the words YES or NO and connect them to new rectangles, or back to previous rectangles when earlier steps must be repeated.
Following those steps, here is what your new flowchart would look like:
Now, feeling much more confident about how your customer order process is going to play out, you finish your business plan, keep your bank appointment – and get the loan you need to start cranking out t-shirts.
Flowchart use cases
Flowcharts are so versatile, we’re confident you’ll have no trouble finding ways you, your team, and your company can use and benefit from them – especially when you need to:
- Lay out the processes for creating new products or systems
- Explore areas where quality or efficiency might be improved in an existing workflow
- Visualize the tasks or decisions that will go into planning your next project
If you need a little more help getting started, here are some additional flowchart examples in the form of specific use cases.
Company A wants to improve their approach to sales training.
With sales department turnover high – and exit interviews showing departing reps weren’t always confident in their ability to close a sale – the company realizes they need to provide new sales hires with better training. They use a flowchart diagram to document their sales process from beginning to end, and use it as the central talking point in onboarding sessions going forward.
As the company’s sales rep performance improves, turnover goes down, and revenues go up.
Company B wants to create a simple, but effective set of product instructions.
Despite its popularity, surveys show many customers find the company’s flagship product difficult to put together and operate. Determining they need a set of instructions to simplify these processes for future buyers, the company prints up flowchart diagrams that illustrate product assembly and troubleshooting procedures, step-by-step.
By providing these instructions with their product, the company soon finds they’re spending less time on after-sales support.
Company C wants to customize their service.
The company has experienced great success with their basic house-cleaning service, but receives many requests for add-ons like window washing and upholstery cleaning. Recognizing that customized packages will necessitate additional time, equipment, and staff, the company uses flowcharts to lay out revised workflow options and determine cost feasibility. Ultimately, they discover customizing their service isn’t financially viable right now.
The company decides to put customization on hold until they’ve explored opportunities for outside investment.
Remember, whatever your reasons for needing to visualize a process or workflow, MindManager has the flowcharts to make your job easier – and a free trial to help you get started today!
Downloadable flowchart samples from MindManager
Click the images below to access the flowchart samples shared above. Click “Menu” in the bottom left corner of your browser window, and then click “Download” to get a copy of the template. Open the template in MindManager to start working.
Don’t have MindManager? No worries! Try it free for 30 days.
Reference:
Armstrong, L. (2021). Flowchart Diagrams: What Are They And How To Use Them. Available at: https://blog.mindmanager.com/blog/2021/04/flowchart-diagrams/ [Accessed: 11th May 2021].