Summary for refresh your Power BI Dashboard
This blog will guide you through the following steps:
- Power Pivot
Create a Power Pivot data model in Excel by importing SQL Server on-premises data
- Power View
Create a Power View dashboard in Excel using the data model
- Power BI
Upload the Excel file to Power BI
- Data Refresh
Setup data refresh by installing the Data Management Gateway and configuring a Power BI Data Source
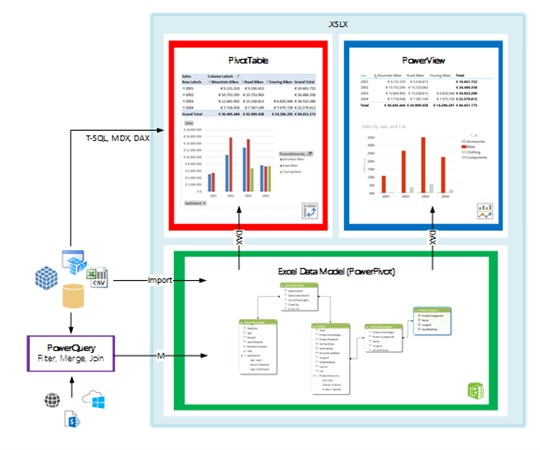
Power Pivot
Power Pivot was first introduced in Excel 2010 as a free downloadable add-in. Since 2013 it is a first class citizen of Excel 2013 Professional. It consists of a set of tools that allows a data analyst to create a data model by importing tables from all kinds of data sources like SQL Server, Oracle and CSV. These tables can be related via relationships much like you can in MS Access. This model can be further enriched by adding Hierarchies, DAX calculation and KPI’s.
Let’s start by creating a data model for our Power View report:
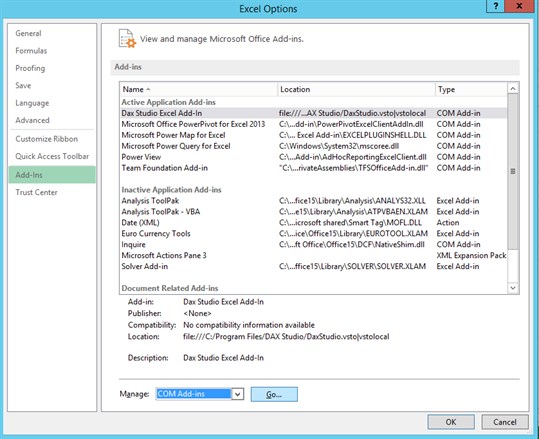
First we need to enable Power Pivot in Excel: -> Options -> Add-ins -> Manage -> COM Add-Ins -> Go -> Check Power Pivot:
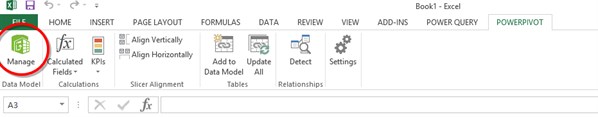
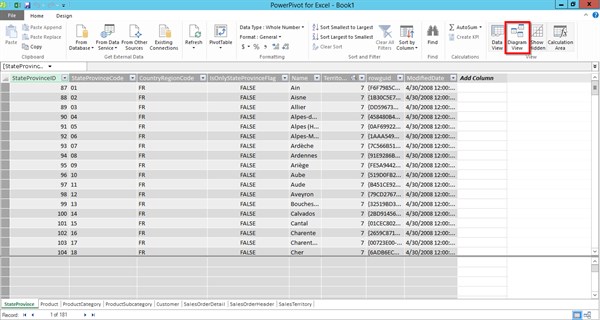
Next we go to the Power Pivot Tab in Excel and click on Manage:
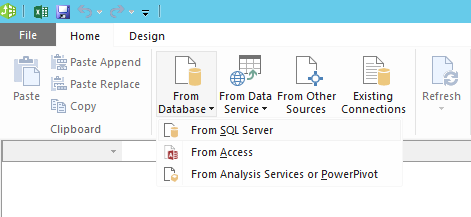
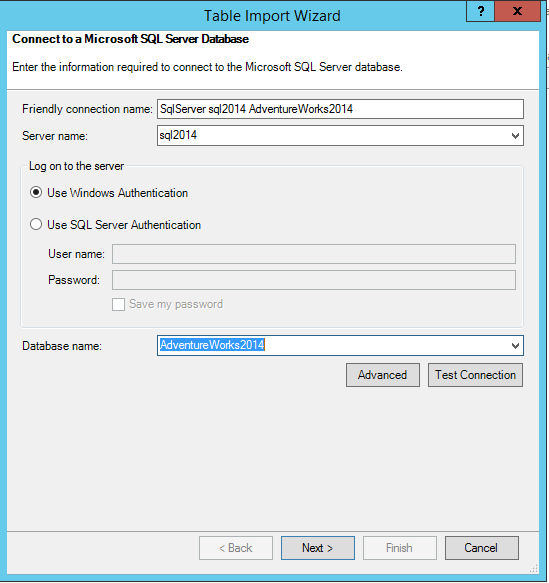
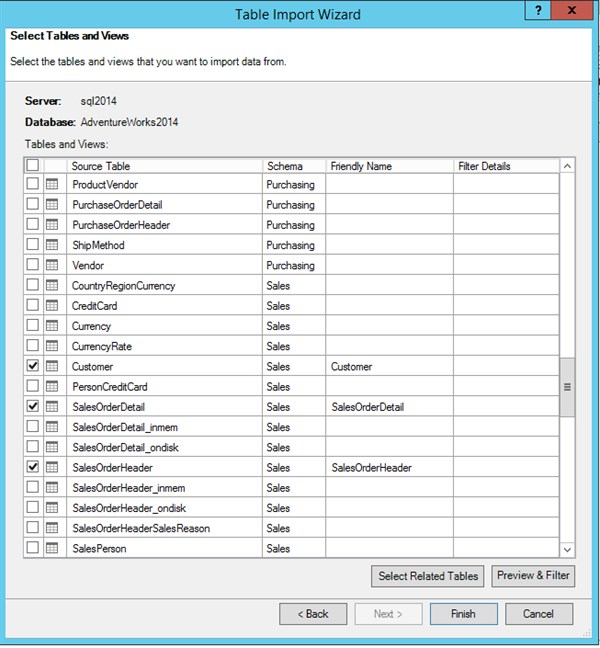
Import the desired tables from SQL Server:
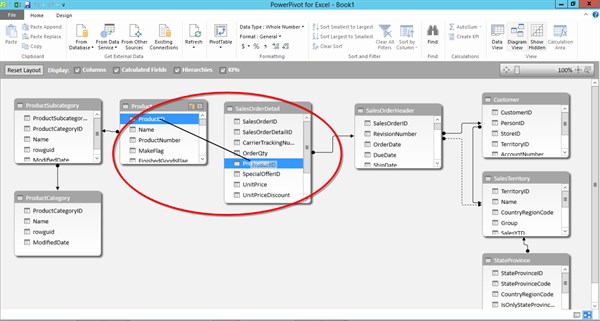
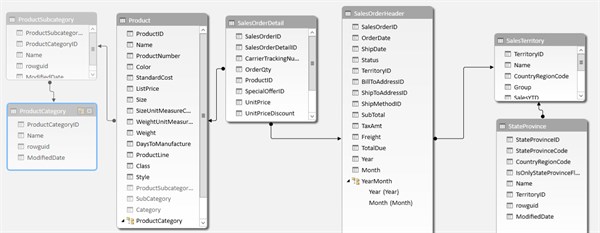
The relationships between the tables are created automatically if they exist in the underlying source system like SQL Server. If this is not the case or if you are importing data from multiple sources go to the Diagram View to manually create the relationships:
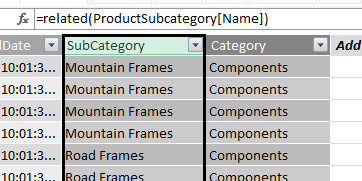
To create hierarchies we need all the levels of the hierarchy to be in the same table. To create a Product Hierarchy (Category – SubCategory – Product) all three fields need to reside in the Product table. You can accomplish this by adding calculated columns to the Product Table using the DAX Function RELATED:
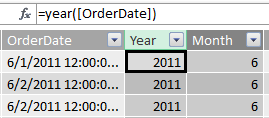
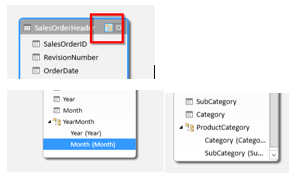
To create a Year – Month Hierarchy in the SalesOrderHeader Table you can add Calculated Columns using the Year and Month functions:
The Hierarchy can be created in the diagram view by clicking on top right button and dragging the calculated columns in the correct order:
To simplify the data model you can then choose to hide the tables ProductCategory + ProductSubCategory from the client tools:
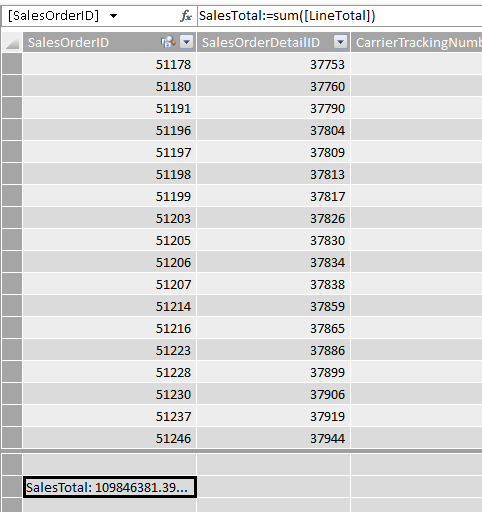
The last step in the data model would be to create calculated measures, we keep it simple and only add a SUM calculation on the LineTotal Column named SalesTotal:
Power View
This technology was first introduced in SharePoint Server 2010 as part of Reporting Services. With a separate Power View Report Builder users could create rdlx files from a PowerPivot Excel sheet uploaded to a PowerPivot Gallery. Since Excel 2013 this technology is also embedded inside Excel.
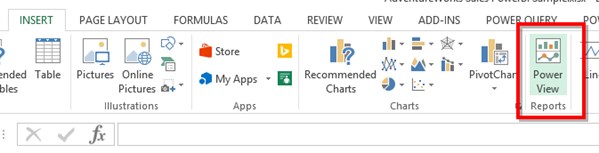
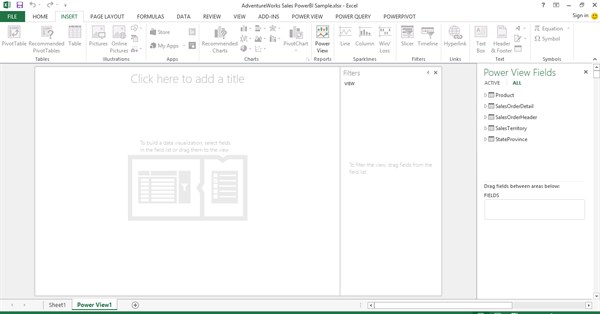
Click on the Power View button in the Insert tab to start:
A new Power View Worksheet is created for you with on the right-hand side all your tables and expressions from the data model.
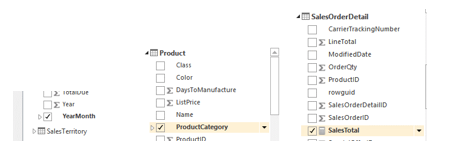
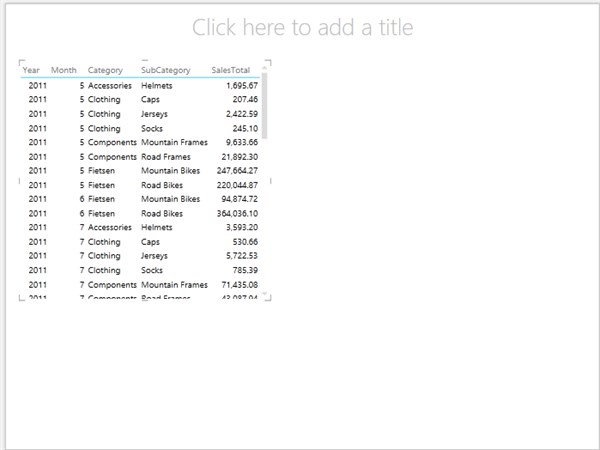
Select the fields that you want to see in the report and a table will be shown with the data:
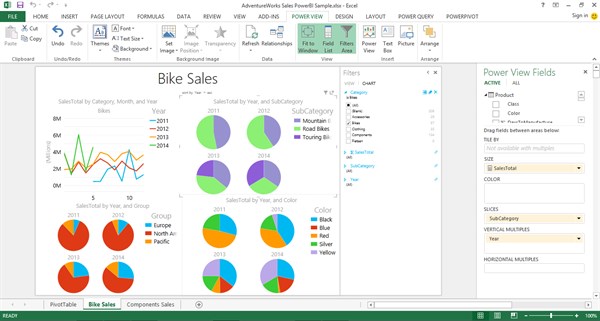
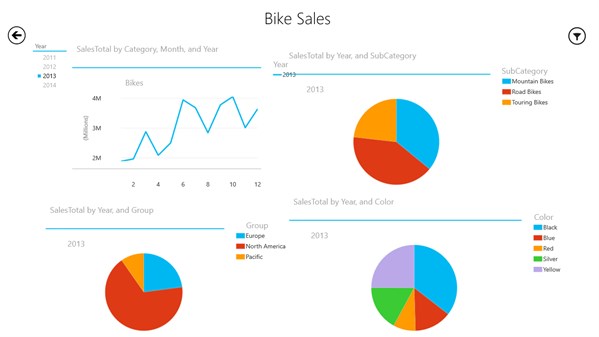
By clicking in the ribbon you can select different visualizations like a pie chart or a line chart:
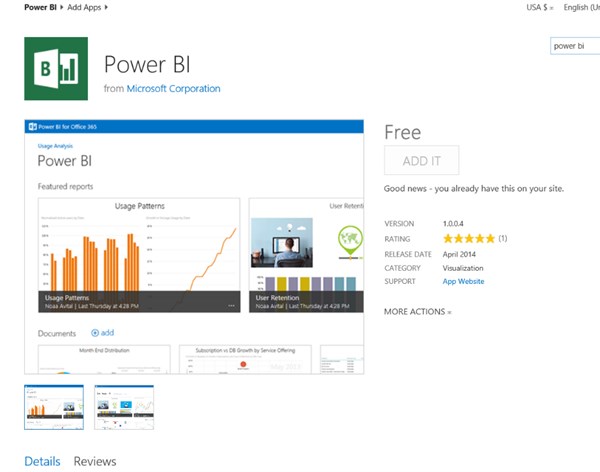
Power BI
To create BI Dashboards in the cloud Microsoft introduced Power BI in 2014 as an add-on subscription to Office 365. This paid subscription allows Excelsheets (with or without a datamodel/Power Pivot) up to 250 MB to be rendered in Excel Services. Normally the maximum size would be 10 MB.

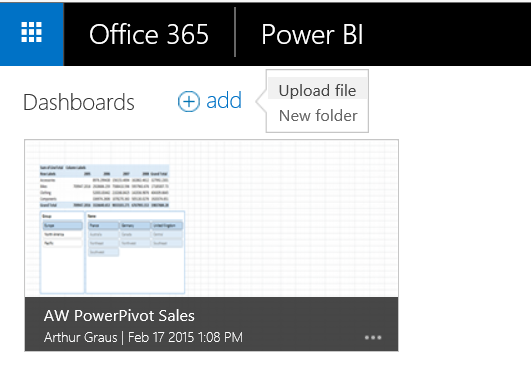
When you click on the Power BI App from the SharePoint Site (Site Contents) you enter the start page of Power BI which displays all the Document Libraries in your SharePoint Site with the containing Excel Dashboards.
By clicking on the Add button you can upload your Excel workbooks containing a combination PowerPivot, PowerQuery + PowerView:
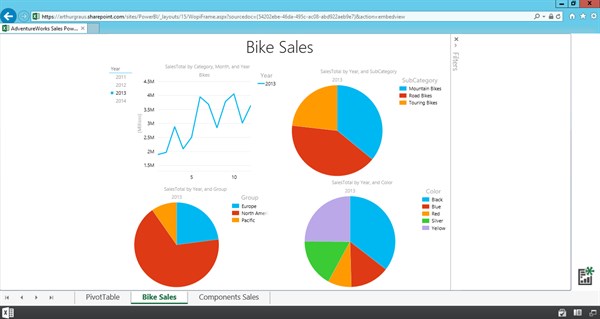
After uploading you interact with the dashboard from your browser:
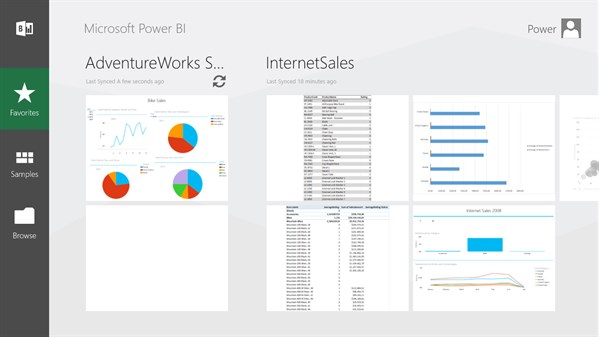
The uploaded Excel Dashboards are also viewable through the Power BI App on several devices, including Windows 8, IPhone, IPad and later this year followed by Android + Windows Phone:
Data Refresh
Besides showing your Dashboard on multiple devices the second most important feature of Power BI is it’s Scheduled Data Refresh via the Data Management Gateway:
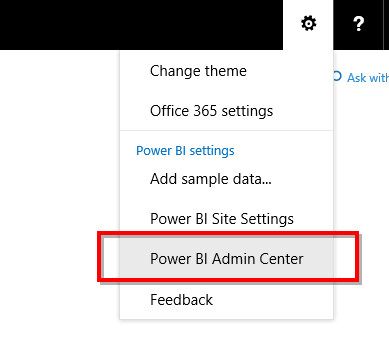
To setup data refresh go to the Power BI Admin Center:
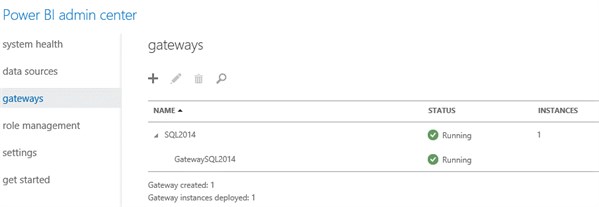
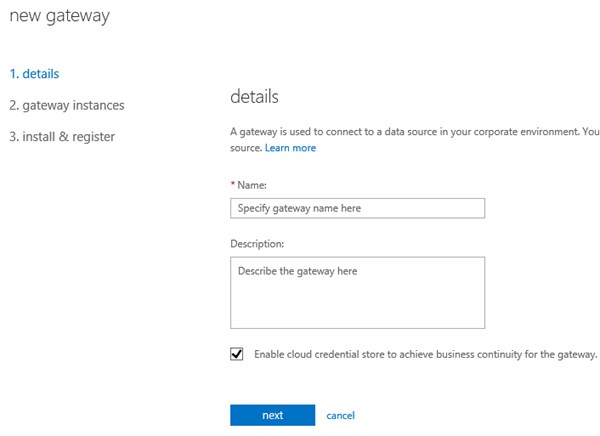
The first thing that needs to be done is creating a Gateway:
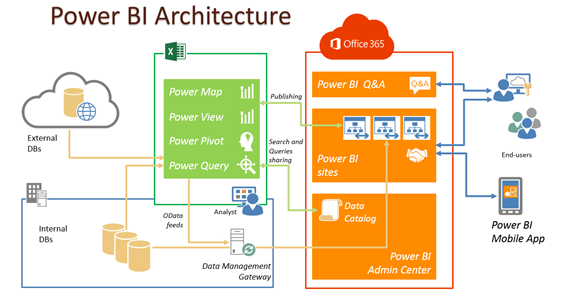
The gateway connects to a Data Management Gateway (DMG). The DMG is a piece of software that is installed on one of your on-premises servers. When a Power BI dashboard needs to be refreshed the DMG will be notified of the data request and it will push the fresh data to Power BI. The databases will never be directly accessible from the internet.
For more details on how to install the Data Management Gateway go to:
https://support.office.com/en-US/Article/Create-a-Data-Management-Gateway-2ddfe0c0-bdb3-42e9-b179-aa5e39e7eab9?ui=en-US&rs=en-US&ad=US
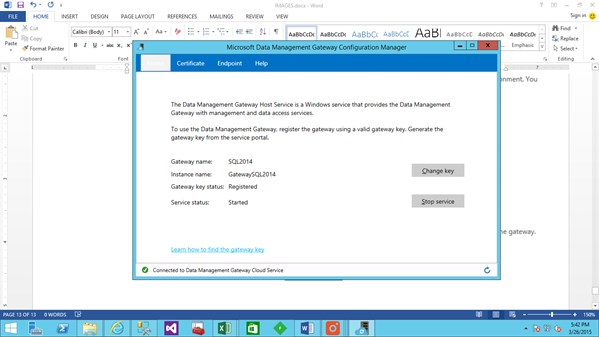
The DMG will look like this when it is successfully installed and connected to Power BI:
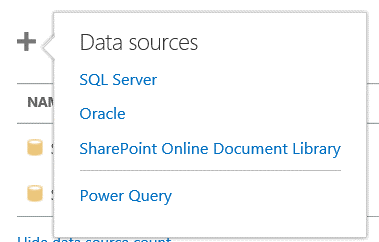
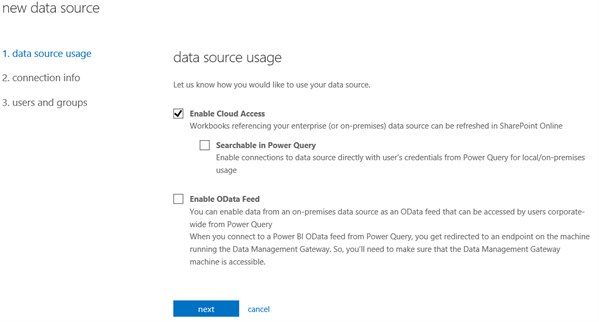
The next steps will be creating data sources that can be refreshed via the Gateway:
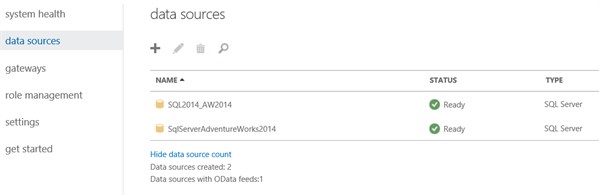
At the moment only SQL Server, Oracle and SharePoint online are supported data sources for refresh. Both connections via PowerQuery and direct imports in the data model (like in this blog) are supported:
The option “Enable Cloud Access” needs to be checked in order to refresh the on-premises data:
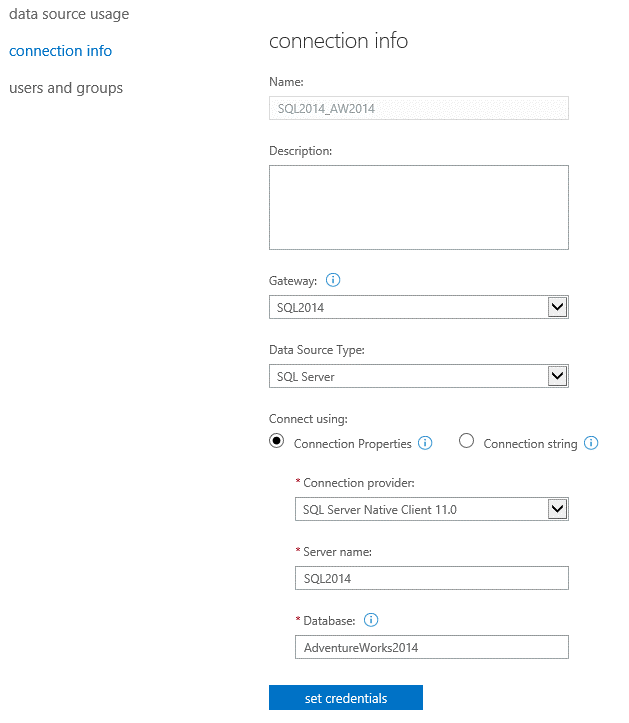
In the next step you enter the exact same connection details (also Connection Provider!) like you entered in Excel. Via the button “set credentials” you can enter a domainusername and password as which the DMG needs to impersonate during the data refresh:
For more information on creating the data source go to:
https://support.office.com/en-US/Article/Create-a-Data-Source-and-Enable-Cloud-Access-c314605d-22fb-4a70-b487-2c8948aca492?ui=en-US&rs=en-US&ad=US
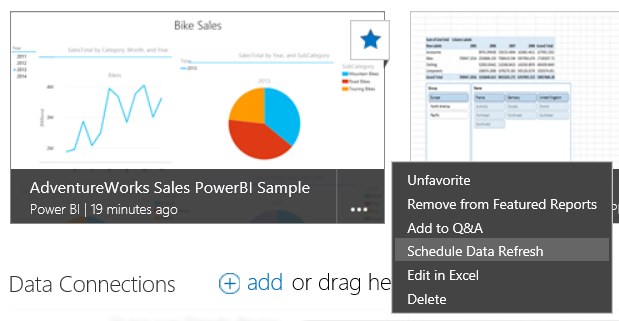
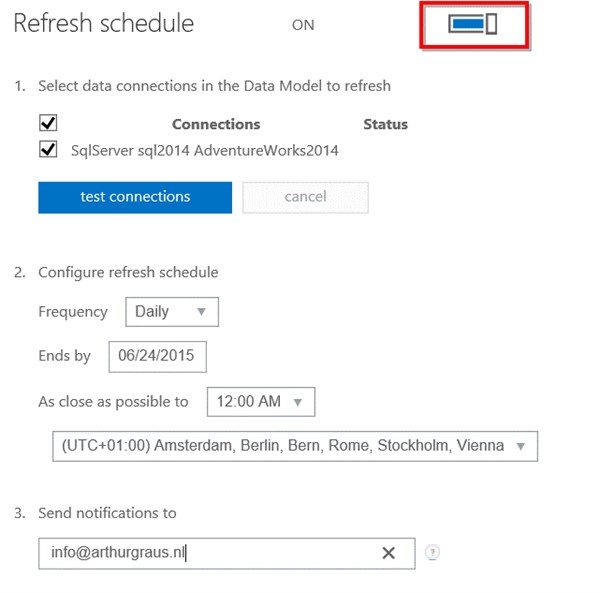
After setting up the gateway and data source it is time to schedule the actual data refresh:
To test the Data Refresh I updated the color of all the Black Products in SQL Server into Snow White, and after waiting for a while….
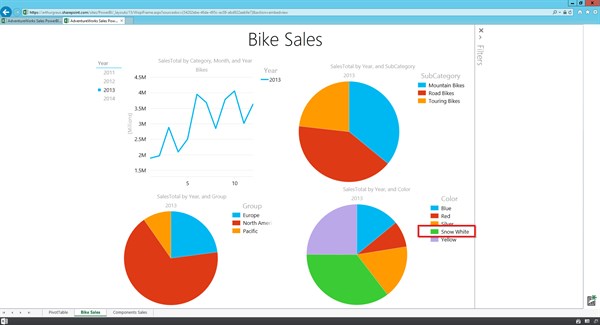
The data was being refreshed automatically from the on-premises database!
About the Author Arthur Graus:
 Arthur Graus is an independent trainer and consultant specialized in SharePoint Development and SQL Server BI. By combining the best of both worlds he helps companies to build Management Information portals and Dashboards in SharePoint. As a Microsoft Certified Trainer he trains PowerUsers, IT Pro’s, Developers and BI Specialists how to find their way in the SharePoint jungle. Before working as an independent he worked as a Microsoft Consultant for Atos, a big multinational IT services corporation.
Check out last years European SharePoint Conference video:
European SharePoint Conference 2015 takes places in Stockholm Sweeden from 9-12 November 2015. View Programme>>