Why should a tenant admin care about the Microsoft Graph Developer Proxy?
Many Tenant Admins are becoming more familiar with the Graph API and seeing the benefits of using it to manage Microsoft 365 tenants. Some of the concepts you need to understand to use the Graph API can seem a bit more “developer” than “admin” but once you understand the core concepts, it can be a very powerful tool.
The release of the Microsoft Graph Developer Proxy is very much pointed at developers who leverage the Graph API for custom-built applications and generally process a lot of data through the Graph. For example, an application which requests a large amount of data may come across throttling from the Graph. This can interrupt the flow of the app and if not handled correctly in the code, can produce unexpected results and missing data.
This problem isn’t unique to develops though, admins can come across similar issues when building out code that uses the Graph API – in my case, usually through PowerShell. Using this same example, a long running or request intensive PowerShell script can also run into throttling (Such as in this OneDrive File Structure and Sharing Report).
The benefit of the proxy is to simulate this type of error for Graph calls to help you build logic into your code to handle errors. For many scripts as mentioned above, demo or small environments may work perfectly but larger or production environments with more data can often cause issues. This isn’t limited to the throttling example I’ve outlined, it can also simulate other errors and even simulate mixed success / error scenarios.
Setting up the proxy using default configuration
The first step in using the proxy is to download it from the GitHub repository here. Once downloaded to your machine, open up the folder and run the mgdp.exe file. The first time you run you may be prompted to trust the root certificate as shown in Figure 1.

Figure 1: Trust the root certificate
I was also prompted on my machine by Windows Defender Firewall to allow the proxy app to connect outbound – it’s worth keeping note of the requirements if you need to run the proxy on a restricted corporate device.
Once that boring stuff is out of the way, the proxy will run in a command line interface as shown in Figure 2.

Figure 2: The proxy runs in a command line interface
The default settings when just running the proxy like this will run the proxy with the default settings as detailed in the documentation and table below. Key points here are it will return errors 50% of the time and run on port TCP 8000. It will also return all supported error codes which are 429, 500, 502, 503, 504, 507 as detailed here.
| Setting | Description | Command-line option | Allowed values | Default value |
port | The port for the proxy server to listen on | -p, --port <port> | integer | 8000 |
logLevel | Level of messages to log | --logLevel <loglevel> | string | debug, info, warn, error |
failureRate | Rate of requests to Microsoft Graph between 0 and 100 that the proxy should fail. Set to 0 to pass all requests to Microsoft Graph, and to 100 to fail all requests. | -f, --failure-rate <failurerate> | 0..100 | 50 |
mocksFile | Provide a file populated with mock responses | --mocks-file <mocksfile> | text | responses.json |
noMocks | Don’t use mock responses | -n, --no-mocks | true, false | false |
allowedErrors | List of errors that the developer proxy may produce | -a, --allowed-errors <allowederrors> | See Supported HTTP error status codes | All supported error codes |
urlsToWatch | List of URLs allowed for testing | n\a | Absolute URL (can contain wildcards) eg. "https://graph.microsoft.com/v1.0/*" | See App settings file |
labelMode | Set the console output label mode | n\a | string | text, icon, nerdFont |
Optionally, the proxy can be made available from any directory by following the instructions here.
Running with custom settings
The standard settings are fine for an initial test but to really get the most from the developer proxy, custom settings should be configured. This can be done in one of two ways, either by modifying the appsettings.json file in the proxy directory or by running it from command line with the settings passed at runtime.
For example, by changing the rate and allowed errors default settings in Figure 3:
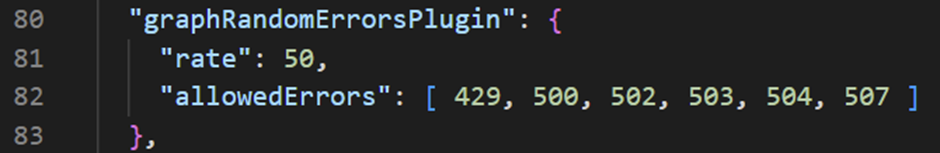
Figure 3: Default settings for the proxy
Updating these settings to what is shown in Figure 4 will force 100% of requests to report a 429 (Too many requests) error code.

Figure 4: Updated settings for force 429 errors for every request
Alternatively, the same behaviour can be achieved by running the following cmdlet when starting the proxy service:
mgdp –failure-rate 100 –allowed-errors 429
Testing the Proxy in PowerShell
When the proxy is running with your desired settings, run a request to the Graph API via PowerShell as shown in Figure 5, the specific proxy behaviour is also displayed in the proxy window.

Figure 5: With the proxy running, it returns error codes as specified in the config
Now that we are forcing errors, we can look at building in some error handling into our scripts and easily testing them. For example, to allow for 429 throttling (too many requests) responses, run the proxy with a 50% failure rate and only 429 errors. Once running, we can catch the error from Invoke-WebRequest and identify the status code of 429. A simple way to report this is with the cmdlet below (shown in Figure 6)
try{
Invoke-WebRequest -Headers @{Authorization = “Bearer $($Token)” } -Uri $apiUri -Method Get
} catch {
$_.Exception.Response.statuscode
}


Expanding upon this a bit we can run something like the below to add a cool off period when we hit a 429 status code:
Do {
Try {
$Results = (Invoke-RestMethod -Headers @{Authorization = “Bearer $($Token)” } -Uri $apiUri -Method Get)
$HeaderCheck = $null
}
catch {
$HeaderCheck = $null
$HeaderCheck = $error[0]
if ($HeaderCheck.Exception.Response.StatusCode -eq 429) {
write-host “Throttling encountered accessing $Apiuri, backing off temporarily” -ForegroundColor Yellow
start-sleep -Seconds 30
write-host “Resuming..” -ForegroundColor Yellow
}
}
}Until($HeaderCheck.Exception.Response.StatusCode -ne 429)
This is a rudimentary way of handling throttling and you could get fancier with a bit of work by looking at the retry-after header in the response to tailor the cool off period. Using the code above, we introduce a 30 second delay whenever a 429 response is returned (Figure 7)
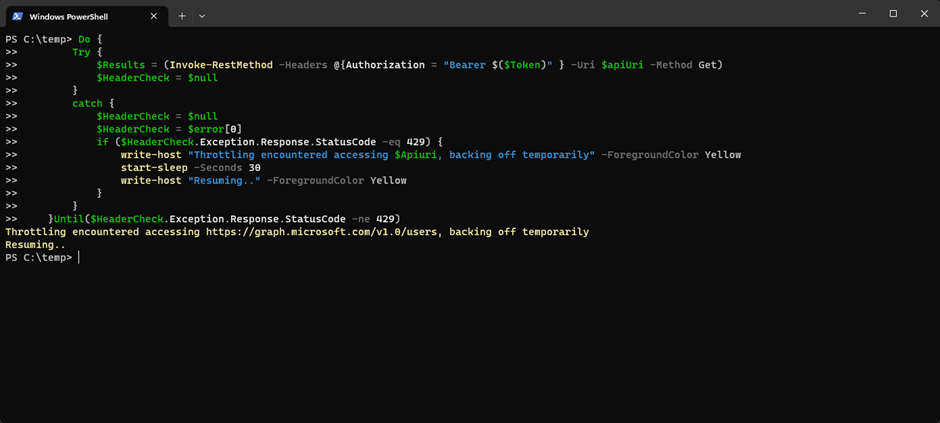
Figure 7: Introducing a 30 second delay to requests when a 429 response is returned
Summary
In this article I’ve shown some very basic ways the proxy can help you build more robust Graph API PowerShell scripts but this can be expanded upon to really enhance error handling when querying the Graph. The proxy makes testing easy so that your scripts are ready to be run in production environments with some extra bells and whistles to improve their reliability.
Interested in learning more SharePoint?
About the Author
I have been working in the IT industry since 2011 as a support engineer, senior engineer and now specialize in Microsoft Modern Workplace as the Modern Workplace Lead at Ergo Group.
Reference
Mc Avinue, S., 2023, Improving your Microsoft Graph PowerShell Scripts with the Graph Developer Proxy, SeanMcAvinue.net, Available at: https://seanmcavinue.net/2023/03/24/improving-your-microsoft-graph-powershell-scripts-with-the-graph-developer-proxy/ [Accessed on 3 May 2023]