Teams Network Traffic Introduction
Have you ever wondered how much network traffic Teams uses? I have. Not just for curiosity, but for performing a network impact assessment when helping organisations roll out Teams. Although Microsoft do provide estimated figures for this purpose, it doesn’t hurt to see how real-life usage compares for Teams Network Traffic.
I have previously written about preparing your network for use with Microsoft Teams, and part of the process is determining the estimated network bandwidth that Teams will consume and the path it will take. It is vital to determine this before-hand so the network can be prepared and provide a good experience to users of Teams.
Recommended Teams Network Traffic bandwidth requirements
Before I go in to measuring Teams network usage, it’s worth noting the aforementioned bandwidth requirements Microsoft recommend when using Teams:
| Scenario | Microsoft Estimate (up/down) |
|---|---|
| Peer-to-peer audio calling | 30 Kbps |
| Peer-to-peer audio calling and screen sharing | 130 Kbps |
| Peer-to-peer quality video calling 360p at 30fps | 500 Kbps |
| Peer-to-peer HD quality video calling with resolution of HD 720p at 30fps | 1.2 Mbps |
| Peer-to-peer HD quality video calling with resolution of HD 1080p at 30fps | 1.5 Mbps |
| Group Video calling | 0.5-1 Mbps |
| HD Group video calling (540p videos on 1080p screen) | 1-2 Mbps |
Note: These are not exact figures, more an estimation of each scenario – real-life usage will differ
With some ball-park figures in mind, you could just use these as a basis for your network impact assessment. But I wanted to see how real-life figures stacked up against this.
Monitoring Teams network traffic
There are many ways to monitor the Teams client network traffic, but I am going to show you two options. It is important to note, I don’t need to capture the actual payload of the traffic e.g. Wireshark – just more what the traffic is.
Resource Monitor Teams Network Traffic
If you are just concerned with a very rough network usage figure, an easy and basic test can be performed by using Resource Monitor (built-in to Windows). You can use it to monitor the Teams.exe process and see the sent/received bytes per second:
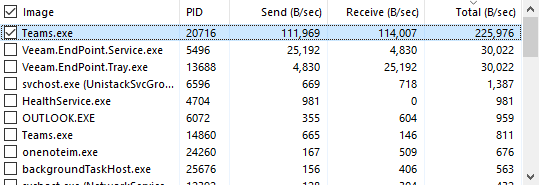
In this example, it was during a peer to peer video call (unknown resolution), roughly consuming 115,000 bytes per second (up and down). If you divide 115,000 by 1,000,000 (bytes to megabytes) and then times by 8 (bytes to bits) you will end up with 0.92 Mbps – so within the 500 Kbps to 1.5 Mbps range that Microsoft estimate for a peer-to-peer video call.
Whilst this is a quick and easy way to see Teams network usage, it does have its limitations:
- You have to watch Resource Monitor and take note what the send/receive peaks are – who wants to do that during a call?
- It is tied to a particular process ID (PID) – Teams actually has more than one process running (you can see this in the example), so there is potential to watch the wrong process or not get the true usage
- There is no breakdown of what the traffic actually is (ports, protocols, IPs etc.)
Azure Log Analytics Service Map
Thankfully there is a tool you can use to record all your network traffic in a much more useful way – Azure Log Analytics Service Map. By installing the Log Analytics Agent and Dependency Agent you can have your machine(s) send all network stream information to a centralised database (workspace) to report upon.
This solution will record all network traffic, not just Teams. Whilst this blog post is centered around Teams, this solution can be used for other network monitoring purposes
Service Map records the following (and more) attributes for each stream every 60 seconds:
- Direction (inbound/outbound)
- IP Addresses (source/destination)
- Ports (source/destination)
- Protocols (TCP/UDP)
- DNS Name
- Remote Location (Country)
- Bytes sent/received
- Status (Live/Terminated/Failed)
- Many more!
This solution is built on Log Analytics, as such it will be charged against this service. Check here for pricing.
Unless you deviate from the retention period of 30 days, you will not be charged for data retention – if you want to track network traffic over a longer period this will need to be extended.
For data ingestion, you will be billed monthly for each GB of data ingested. In my tests, a single machine was generating around 80MB per day (around 2.5 GB per month), but will likely be different based on how many network streams are captured an how many hours the computer is used each day. It’s pretty low-cost to use in small testing scenarios.
Service Map installation
Service Map is split in to two parts:
- Service Map ‘solution’ in a Log Analytics workspace in Azure
- Agents on the target machine(s)
I’ll now cover how to set this up for yourself.
Create Service Map in Azure
Service Map is a ‘solution’ installed within an Azure Log Analytics workspace. You can choose to either install this on a new workspace or use an existing one. In this example, I am using a new workspace.
- Within the Azure Portal, goto Create a resource and search Service Map
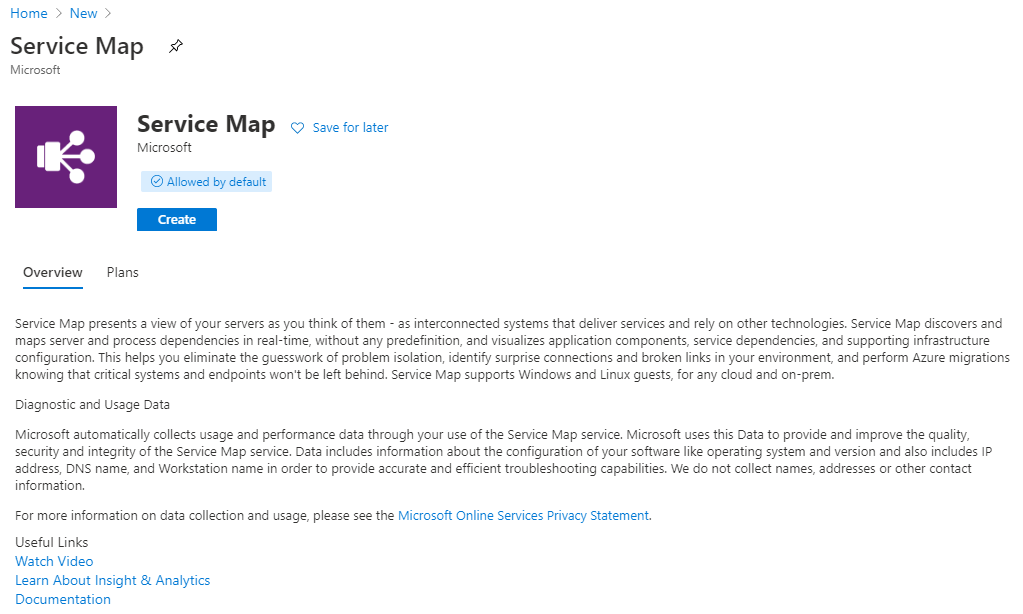
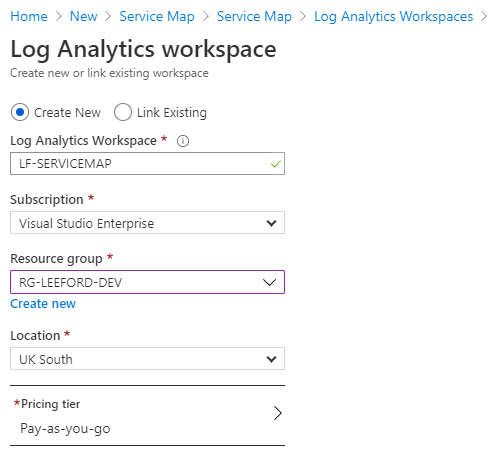
- Click Create and populate a workspace name, resource group and location:
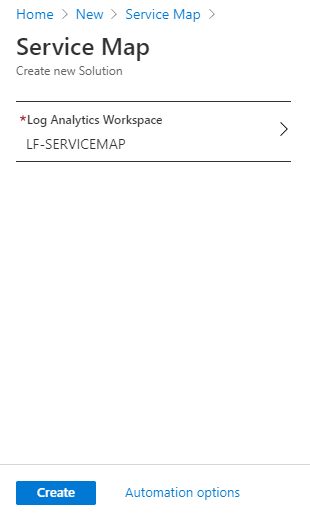
- Click Create to create the workspace, and then Create again to create the Service Map solution in the workspace
- Once finished, locate the workspace and proceed to the agent installation
Install agents
With the Service Map solution deployed in Azure, the final step is to install the Log Analytics agent and Dependency agent (Service Map agent).
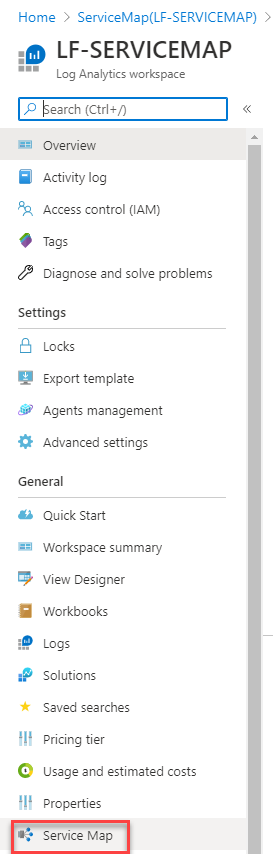
- To get started, under the workspace, click on Agents management

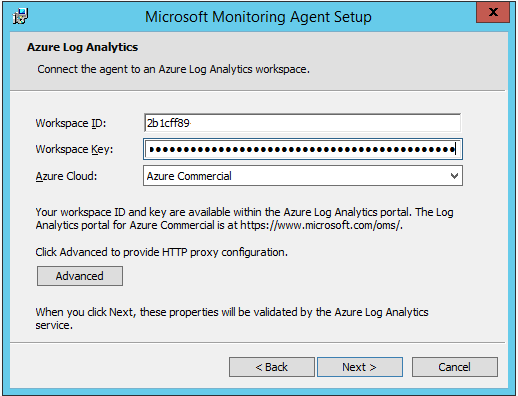
- Under here, download the Windows agent and copy the workspace ID and primary key
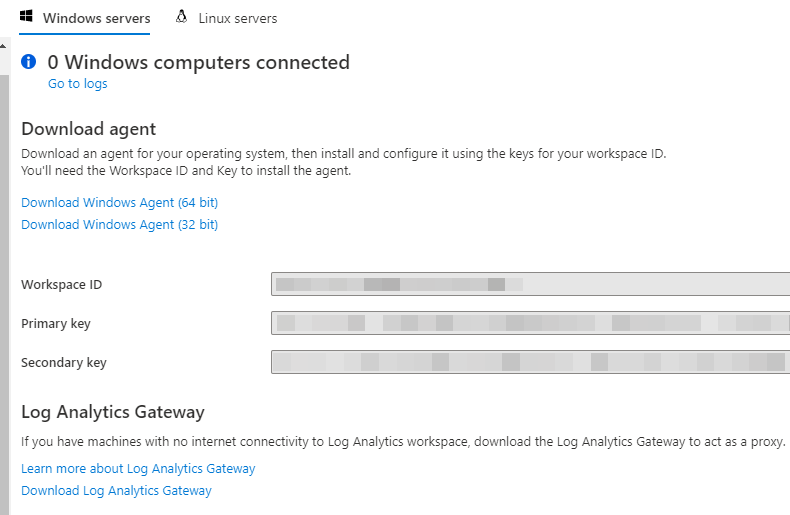
- Next, go to Service Map and download the Windows agent
- Install the Log Analytics agent first – when prompted select OMS as the installation type and provide the
workspace ID and key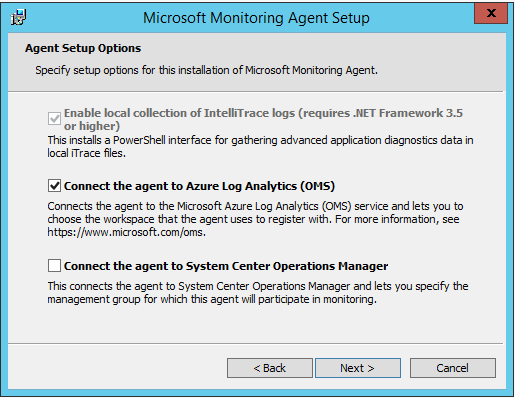
- Finally, install the Dependency agent
After waiting 15 minutes for the agents to start polling data, you should now be able to see some data in Azure
Using Service Map
Service Map data is stored in a Log Analytics workspace. A workspace is essentially a database of logs. Each log type is essentially a “table” in a database with log entries. For this blog post, the log “VMConnection” is what will be used.
I assume this is called “VMConnection” as it was originally intended for Azure VMs
Querying the data
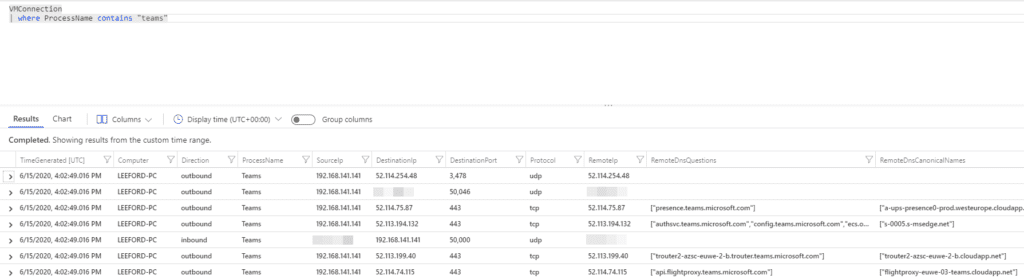
The first step is to locate the workspace you used for Service Map and click Logs on the left hand menu. You should be given a box to type a query in to. For now, type the following to return all network streams that include the process (application) Teams:
VMConnection
| where ProcessName contains "Teams"
As long as Teams has been running on the Agent machine, this should return multiple streams that Teams used: 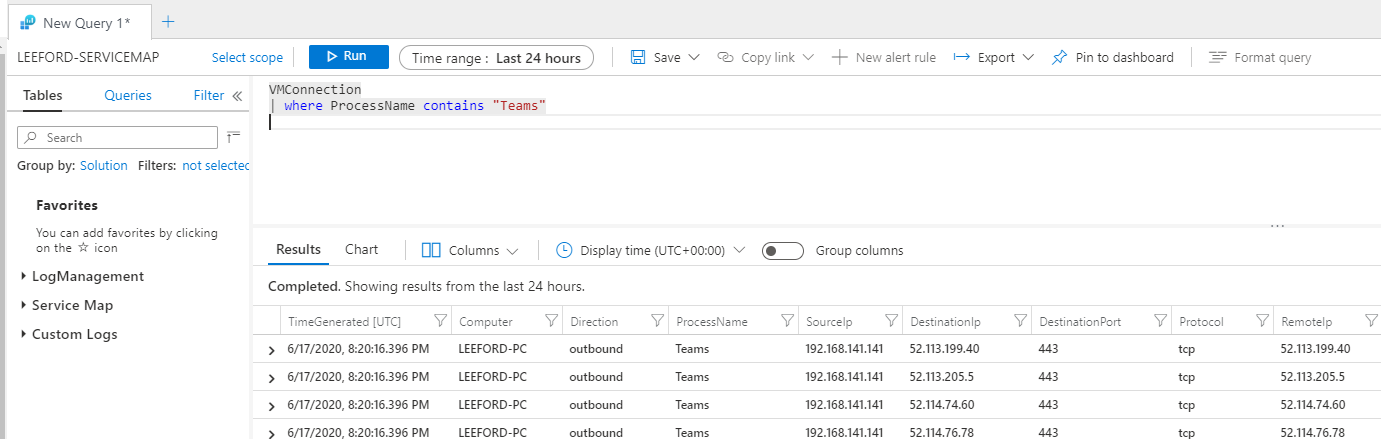
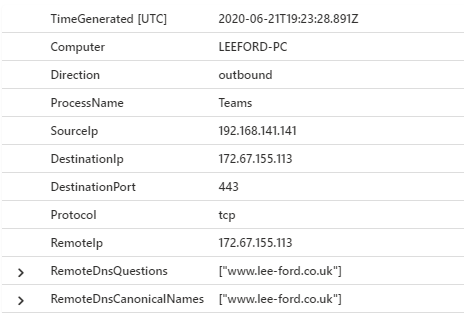
If you dig a little deeper in to a stream, you will see all sorts of useful information:
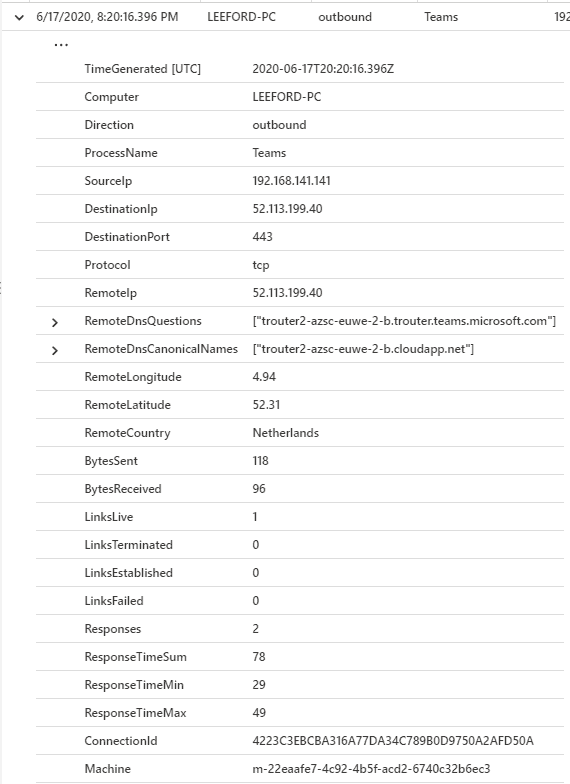
Whilst this post isn’t about troubleshooting, this tool absolutely could be used for that:
- Is my client using TCP instead of UDP streams (big no-no)?
- Are some links failing to establish (blocked ports)?
- Is my client using direct media on P2P calls or using relays?
To make it a bit more readable, you can run queries that output to charts/graphs. This command will plot the Sent and Received Kbps that Teams was using:
VMConnection
| where ProcessName contains "teams"
| project Computer, TimeGenerated, SentKbps = ((BytesSent)/1024*8/60), ReceivedKbps = ((BytesReceived)/1024*8/60)
| render timechart
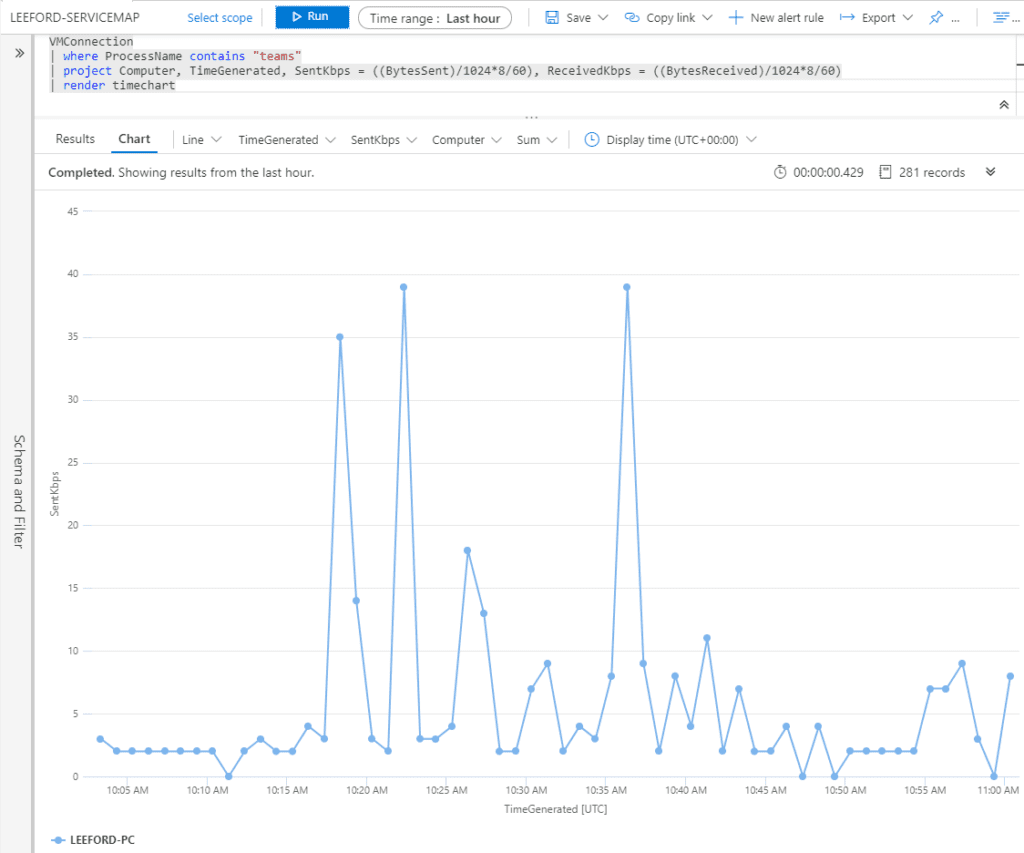
During this period I was on a couple of brief audio calls, which lines up with the estimated usage (additional 30Kbps)
Another example query is highlighting what countries the Teams client is communicating with:
VMConnection
| where ProcessName contains "teams"
| summarize TotalKBReceived = sum((BytesReceived)/1024), TotalKBSent = sum((BytesSent)/1024) by RemoteCountry
| render barchart
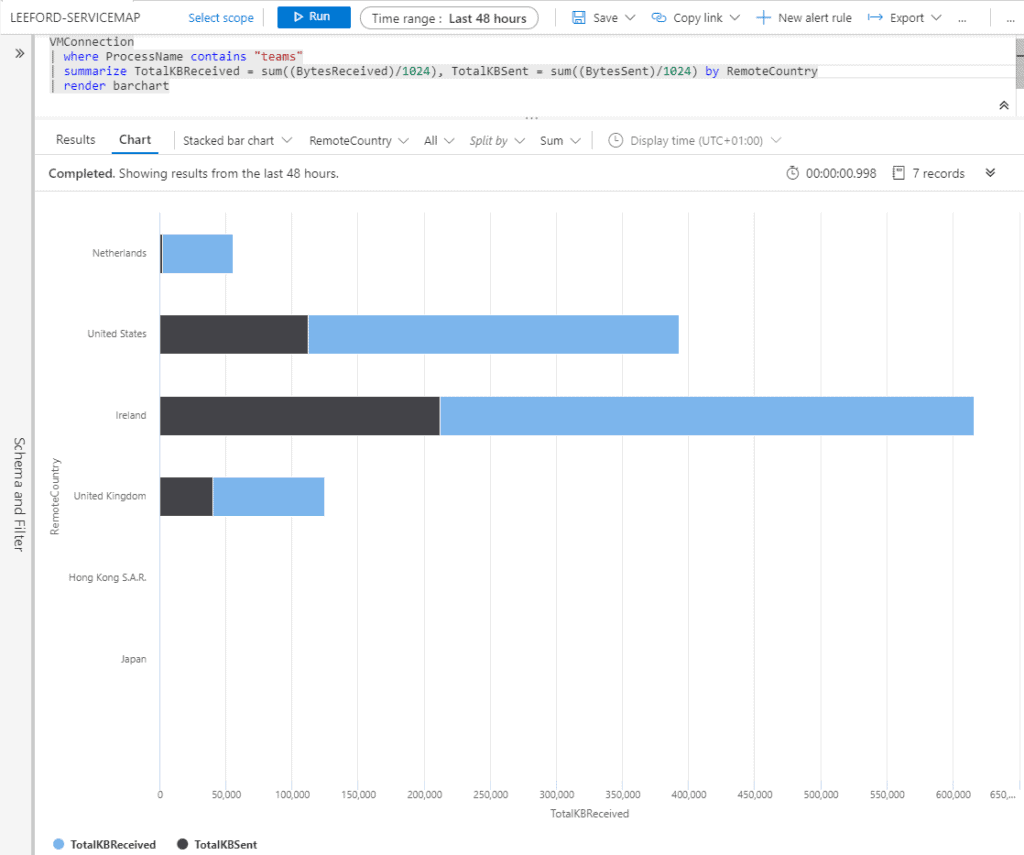
This is just a couple sample queries, whatever information you are looking to glean – there will be a query for it.
Reporting
I will show you a couple of example ways you can integrate this data in to a reporting tool
Azure Workbooks
I won’t go in to detail on how Workbooks are created, but you can use log queries within them to provide information is a more readable format.

Power BI
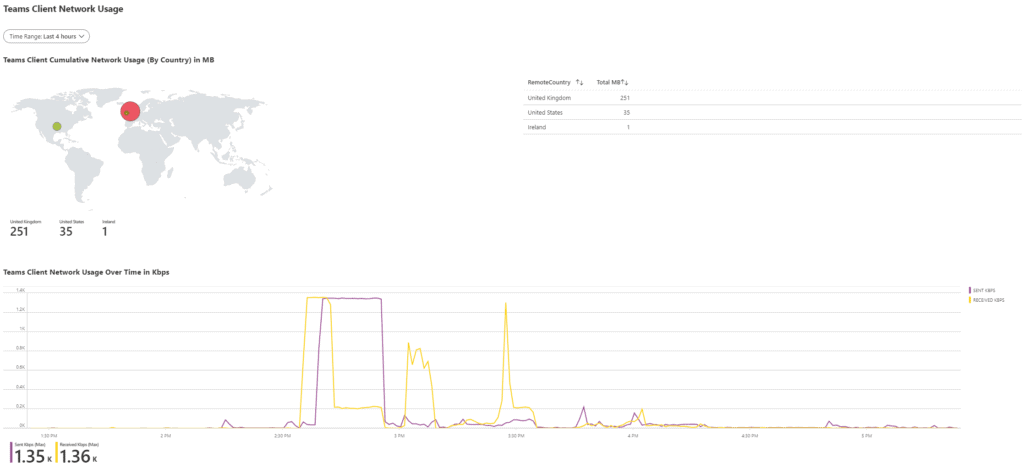
In addition to workbooks, it is possible to export any Log Query to Power BI. On performing a log query, you have the ability to export the query in Power BI query language and can be used as a data source in Power BI.
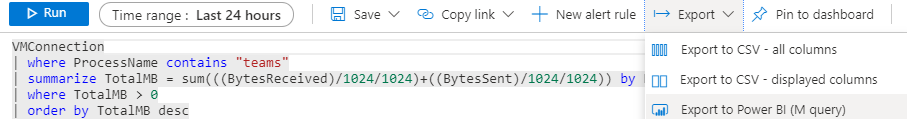
With one log query, you are able to pull through all the data of the Teams network traffic in to Power BI. How you choose to slice it, is up to you!
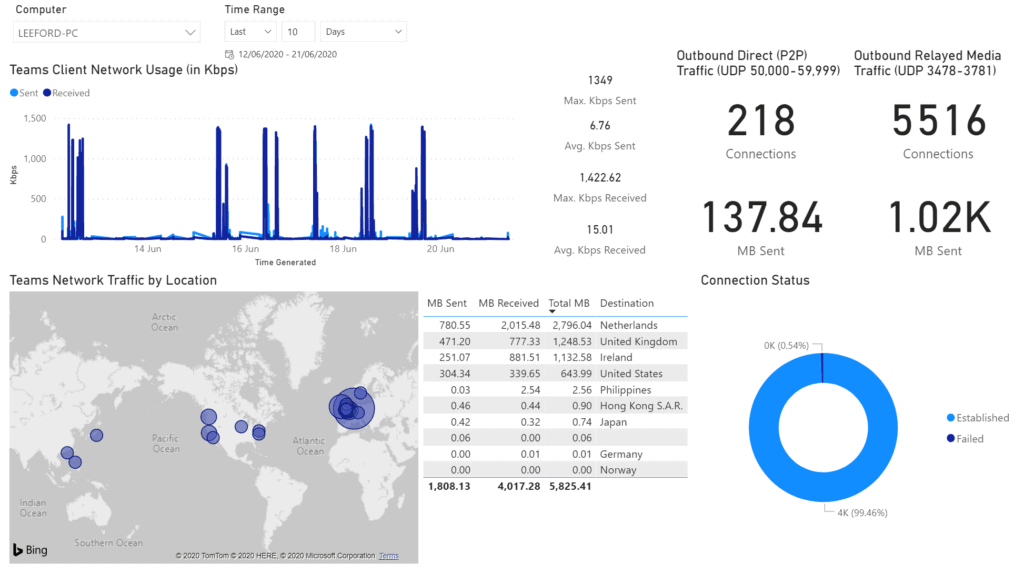
From this report I am able to tell the following:
- Send and receive rates (in Kbps) across a prolonged period, including the average and maximum values
- How much media traffic was sent direct to another Teams client (P2P) and to the Teams service (via relays and media processors)
- Location of traffic that my client was communicating with, including usage
- Failed/established connections
This is something I quickly put together but you should hopefully be able to see how this could be useful.
You download my dashboard from here. You will need to enter your workspace ID in the “AllData” query and sign in using an account with access to the Service Map solution.
Estimated bandwidth usage comparison
After capturing some calls in using Teams, I was keen to see how these compared estimated figures (by Microsoft).
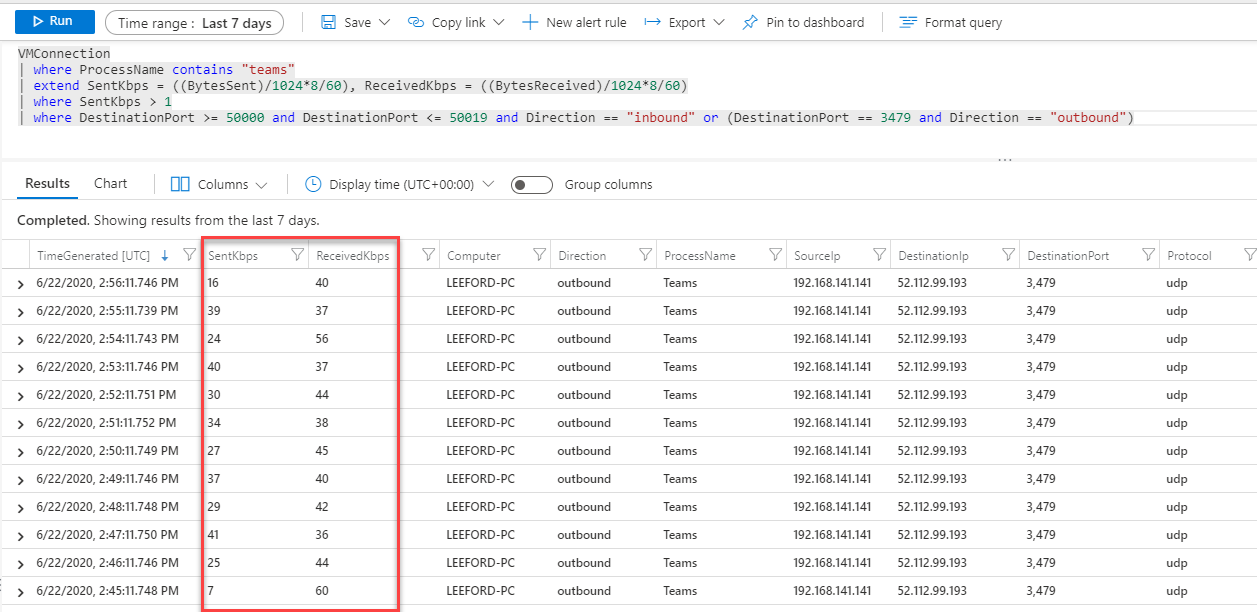
Using a log query, I was able to see the Kbps of each 60 second audio stream.
VMConnection
| where ProcessName contains "teams"
| extend SentKbps = ((BytesSent)/1024*8/60), ReceivedKbps = ((BytesReceived)/1024*8/60)
| where SentKbps > 1
| where DestinationPort >= 50000 and DestinationPort <= 50019 and Direction == "inbound" or (DestinationPort == 3479 and Direction == "outbound")
This query assumes the Teams client is using the default 50,000 to 50,019 client ports for audio. Port 3479 is what the Teams service uses for Audio.
This will list each 60 second network stream and provide the average Kbps over that 60 seconds:
To work out the average value, I just added a summarize to the query:
VMConnection
| where ProcessName contains "teams"
| extend SentKbps = ((BytesSent)/1024*8/60), ReceivedKbps = ((BytesReceived)/1024*8/60)
| where SentKbps > 1
| where DestinationPort >= 50000 and DestinationPort <= 50019 and Direction == "inbound" or (DestinationPort == 3479 and Direction == "outbound")
| summarize avg(SentKbps) by Computer // Replace with '| summarize avg(ReceivedKbps) by Computer' for received average
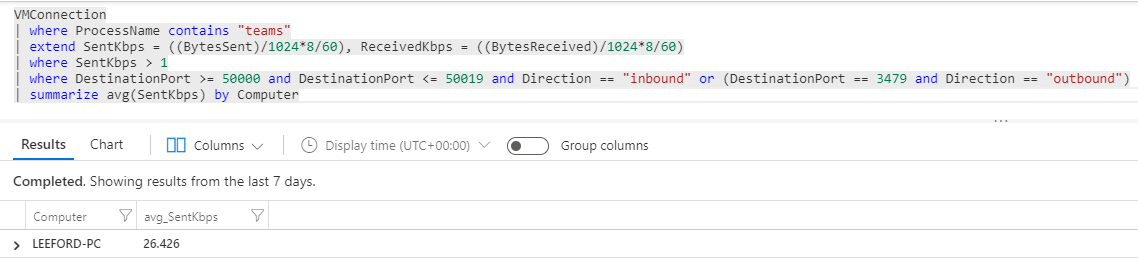
I also did the same for receive:
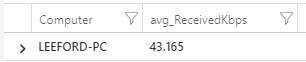
This indicates that all audio calls for 7 days:
- The send average Kbps was 26.426 Kbps
- The receive average was 43.165 Kbps
- You could decide to average the two figures, but I would prefer to go with the larger figure and estimate the same up and down as a ‘worse case’ scenario
I’ve performed this query with two more scenarios and here are my results:
Video Calls:
VMConnection
| where ProcessName contains "teams"
| extend SentKbps = ((BytesSent)/1024*8/60), ReceivedKbps = ((BytesReceived)/1024*8/60)
| where SentKbps > 1
| where DestinationPort >= 50020 and DestinationPort <= 50039 and Direction == "outbound" or (DestinationPort == 3480 and Direction == "outbound")
| summarize avg(SentKbps) by Computer // Replace with '| summarize avg(ReceivedKbps) by Computer' for received average
Note I have combined Peer to Peer and Group calling (as well as resolution) as a combined figure as the ports used are the same no matter the scenario outlined by Microsoft.
Screen Sharing:
VMConnection
| where ProcessName contains "teams"
| extend SentKbps = ((BytesSent)/1024*8/60), ReceivedKbps = ((BytesReceived)/1024*8/60)
| where SentKbps > 1
| where DestinationPort >= 50040 and DestinationPort <= 50059 and Direction == "outbound" or (DestinationPort == 3481 and Direction == "outbound")
| summarize avg(SentKbps) by Computer // Replace with '| summarize avg(ReceivedKbps) by Computer' for received average
Results:
| Scenario | Microsoft Estimate (up/down) | Measured Average (up/down) |
|---|---|---|
| Peer-to-peer audio calling | 30 Kbps | 43 Kbps |
| Peer-to-peer audio calling and screen sharing | 130 Kbps | 160 Kbps = 117 Kbps (Screen share) + 43 Kbps (Audio) |
| Video calling (combined scenarios) | 0.5-2Mbps | 670 Kbps |
Remember, this is what my Teams client was reporting, your figures will/may vary, but as you can see, my results are not a million miles away from Microsoft’s figures.
Conclusion
Having implemented Service Map and monitored of a prolonged period I believe it is a great tool for gauging usage of Teams within an organisation. In an ideal world, I could see this being used to assess potential impact before you fully roll out Teams – ideally in different locations and business functions to see how usage may differ between them.
One key point I’ve not called out – all Teams traffic is captured, so you are also able to capture OneDrive/SharePoint file downloads or any other LOB app that is being used within Teams (which are not covered by Microsoft’s figures). For example, I viewed a website tab to a Team and this traffic was captured:
Another point is that whilst this tool can be useful for diagnosing potential issues that may lead to poor call quality (blocked ports, routing to incorrect region) it won’t monitor any network metrics such as jitter or packet loss. For this, you will still need to use CQD or Call Analytics.
Hopefully you have found this useful you will want to test this solution out for yourself. If you have any questions, please don’t hesitate to get in touch.
Stay safe.
About the Author:
Hi – I’m Lee.
I’m a Microsoft MVP (Office Development) and Solution Architect for Symity based in Birmingham, UK. I predominantly work with Microsoft Teams but also work with other technologies such as Azure, PowerShell, Power Platform, and Microsoft 365.
You can follow me on Twitter at @lee_ford
Reference:
Ford, L. (2020). Monitoring Microsoft Teams Network Traffic. Available at: https://www.lee-ford.co.uk/monitor-teams-network-traffic/ [Accessed: 16th July 2020].