Finally, Microsoft has taken a step forward in Office 365 BI.
One of the most requested features is implemented in this brand new version: The possibility to connect on our on-premise data sources and have our excel spreadsheets updated, but not the last:
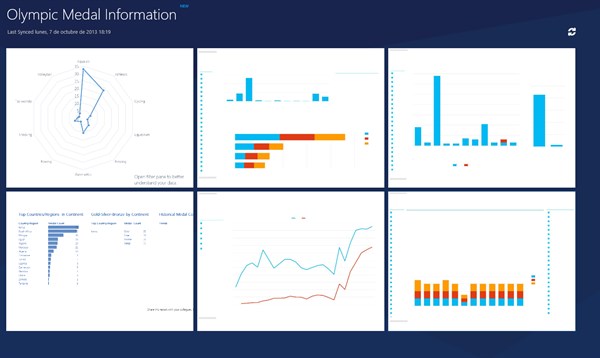
– New Power BI Sites
- This is a new view of our current Sharepoint Site. It transforms our SharePoint Online Site in a place where you could easily share and view Excel Workbooks. To enable this feature, we only need to add the Power BI site app, which is available on Power BI Office 365 Preview.
We could see the same workbooks stored in SharePoint Documents Library also in Power BI sites with a new look:
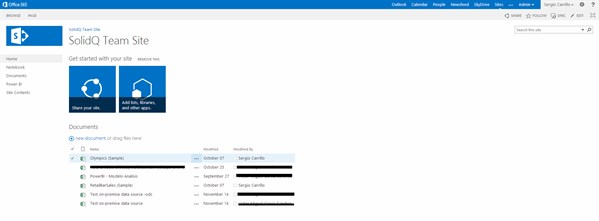
SharePoint Online Site

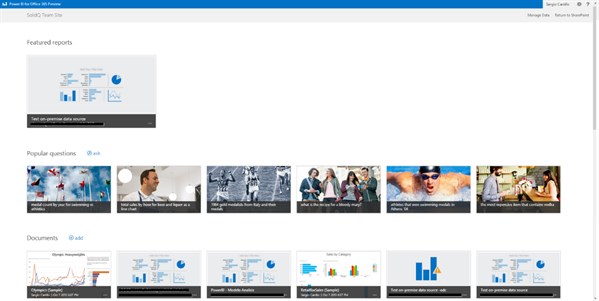
Power BI Site
- We could see the six files and also another new feature, Power BI Q&A
– Power BI Q&A
- This feature allows end-users to make business questions to their data. “Magically” Office 365 will have a response for that question. This opens a new way to interact with our data. Now it is only available in English language and only for the samples, although it will be available for our own data sources in the future.
Power BI Q & A question
– Power View in HTML5
- Power View Reports now run in HTML5. This improvement allows seeing Power View reports in mobile devices natively on iOS and Android platforms. Although this is a huge step forward, not every Power Pivot component is available in HTML5. We cannot see KPIs, Maps, Scatter charts and few more components yet.

- This new app is already available in the Windows Application Store. It’s called Power BI and it has full compatibility with Tablets and Laptops.
The App connects to our SharePoint Site and provides an easy way to explore our data. We will be able to sync our files in order to do some analysis using on our touch devices.
- If we have excel workbooks, every Power View Report and Excel figures, like Pivot Tables or Pivot charts, will be shown as new cards in the App.
- Power View reports are rendered in HTML5
Power View reports in the Power BI App
– Query and Data Management
- This feature provides a way to explore our data through Power Query. The way it works is easy: We can locate some data on our servers or externally and share it through the platform. Then, business users can easily query this data as a new shared data source using Power Query in Excel.
– Data Management Gateway
- With Data Management Gateway we can register on-premise data sources and use them in our excel workbooks. First, we need to download, install and configure the gateway, Data Management Gateway, on an on-premise computer with access to our data server. Then, we have to register the Gateway using the Admin Center.
- Installation and configuration is easy, but it has some restrictions right now. We can only connect to SQL Server Databases as data sources. Some other data sources, like Analysis Services, are not available yet.
- Other restriction is that the computer where we install the gateway needs to run Windows 7, Windows 2008R2, Windows 2012 or Windows 8 operating system. That’s something to keep in mind because, in our experience, there are still a lot of systems under Windows 2003 and Windows 2008 operating systems.
Office 365 BI sites are a great and powerful alternative for small companies. It is cheap and it doesn’t need development nor infrastructure. We also look forward to new improvements like new data sources in the data management gateway, Q&A for our own workbooks and all the Power View components in HTML5.
If you have any questions or feedback on Sergio’s and Ruben’s article please leave a comment below. We would love to hear from you.

Sergio and Ruben
Sergio Carrillo has been involved in Business Intelligence projects from data extraction to data delivery in sectors such as Communication, Textil, Real Estate, Accounting, etc. Sergio is MCSA of SQL Server 2012Rubn Pertusa L’pez is a member of the Business Intelligence department at SolidQ. MCP and MCTS of SQL Server 2008 and BI. His core area is Business Intelligence and Data Warehousing with Microsoft Tools and Microsoft SQL Server.
Ruben Pertusa Lopez is a member of the BI team at SolidQ. An MCP and MCTS in SQL Server 2012 and BI and a Microsoft Active Professional 2012 and 2013, he also has a degree in computer engineering. Ruben has been working in projects for leading retail and telecommunications companies around the world. He has deep skills in BI performance tuning, cube design, and MDX. He has also presented at the SQL Server 2008 R2 Spanish launch event, Codemotion, Microsoft’s Partner Program, and PASS Spain, PASS LATAM, PASS 24H and PASS Business Analytics Conference Chicago.