Following the Microsoft Ignite announcements of changes to the Power Apps and Power Automate licensing, a discussion started within the community about the impact of these changes to partners and customers. In fact, this is the second change to the licensing since these technologies were released to preview and then general availability. While nobody expects Microsoft to provide free software, the initial pricing model caught many people by surprise, and the latest revisions to the licensing was an effort by Microsoft to simplify the licensing.
Even so, many within the community began to share their concerns that the licensing model could limit their use and promotion of Power Apps and Power Automate within independent consultants and small-to-medium businesses. However, there was no data to support these suppositions — and so we decided to launch a community survey to gather some basic data and customer feedback with the goal of sharing this data with Microsoft and the community to further the discussion.
A number of organizations supported this community survey, including PAIT Group, tyGraph, WEBCON, Extranet User Manager, Sympraxis Consulting, IW Mentor, CollabTalk, Techsplaining, and of course ESPC. Additionally, tyGraph collected the data and provided a Power BI model for us to review. We thank these organizations for supporting this community-led initiative.
During #ESPC19 in Prague, Czech Republic earlier this month, I sat down with fellow MVPs Mark Rackley (@mrackley) and John White (@diverdown1964) to discuss the reasoning behind this survey and analysis:
Survey Results
The survey ran for 2 weeks across the latter half of November and resulted in 228 responses. What surprised us initially was the fairly balanced response rate across company sizes. As shown in Figure 1, we had expected a stronger showing from small-to-medium businesses, but we had a great response rate from companies with more than 5000 employees.
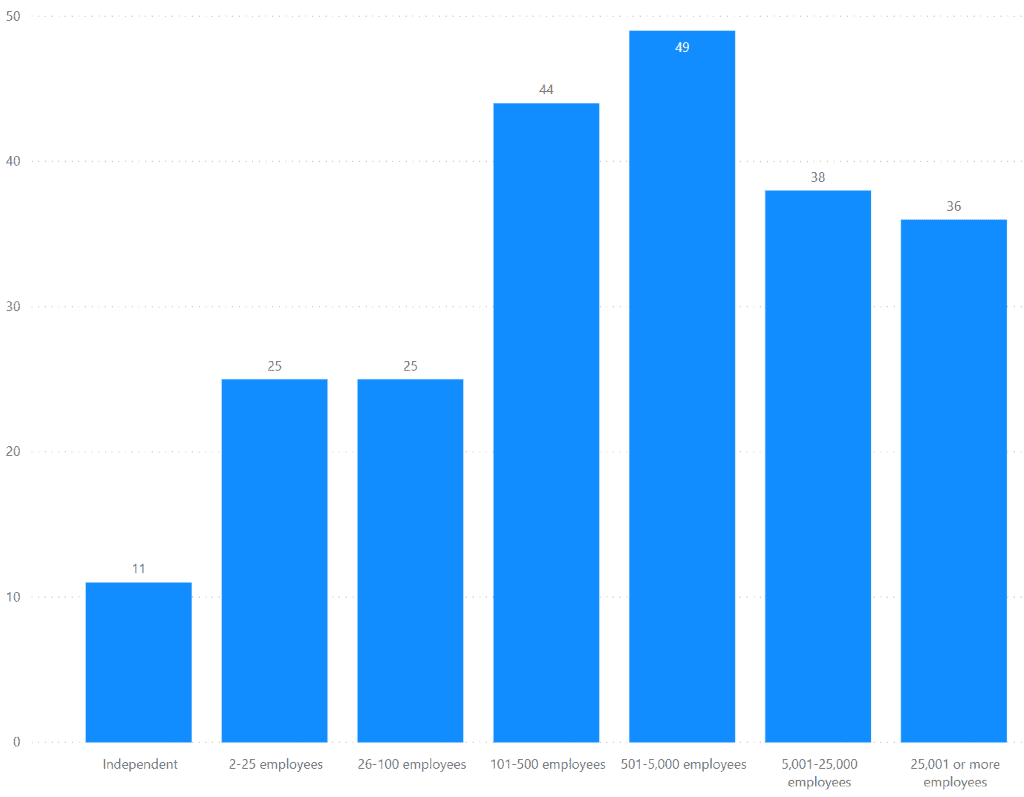
Figure 1 – Respondents by Company Size
We asked respondents to rate the pricing impact to their business from 1 (no impact) to 7 (high impact), and as shown in Figure 2, the results were fairly consistent across company sizes with an average impact of 5.66. Independents (11 respondents) reported the lowest impact of 5.4, and 5,001-25,000 employee organizations (38 respondents) reported the highest impact of 6.2.
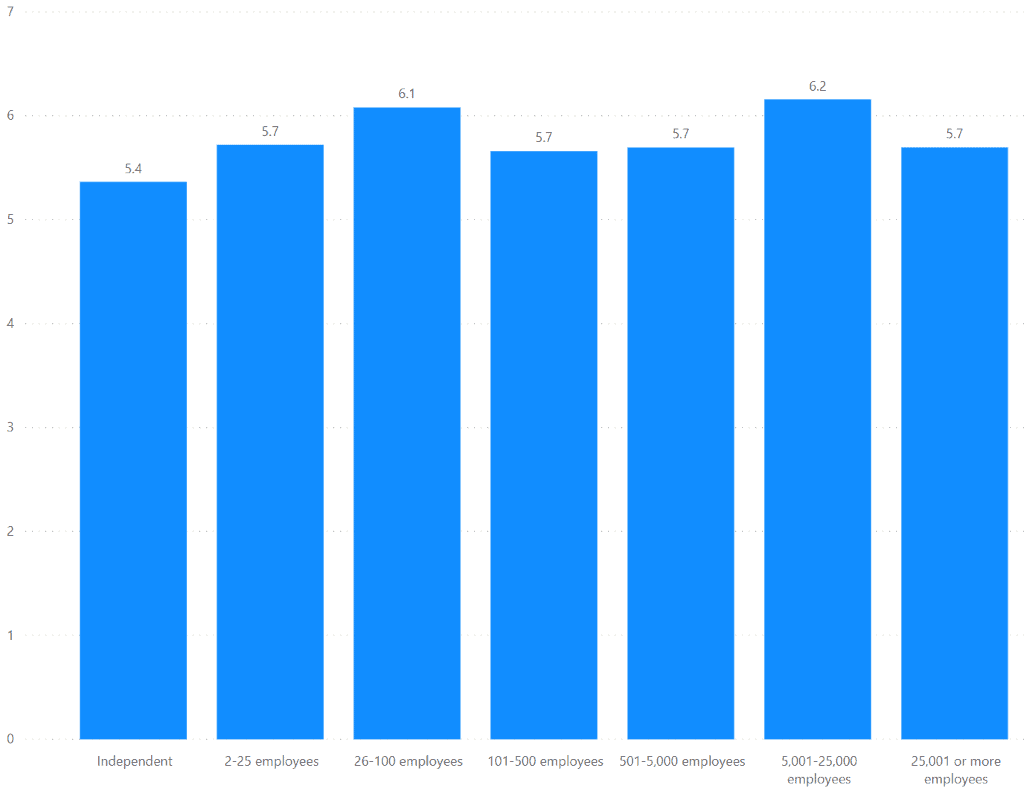
Figure 2 – Perceived Impact by Company Size
While this data point is interesting, the question itself is very subjective and does not allow for any deeper analysis. We added two additional quantitative questions to help us further segment and dissect the results. In Figure 3, we show that a large majority (160 respondents) had reviewed and were familiar with the licensing changes, with the remainder being aware but not yet having reviewed the changes (55 respondents) or unaware of any changes (13 respondents).
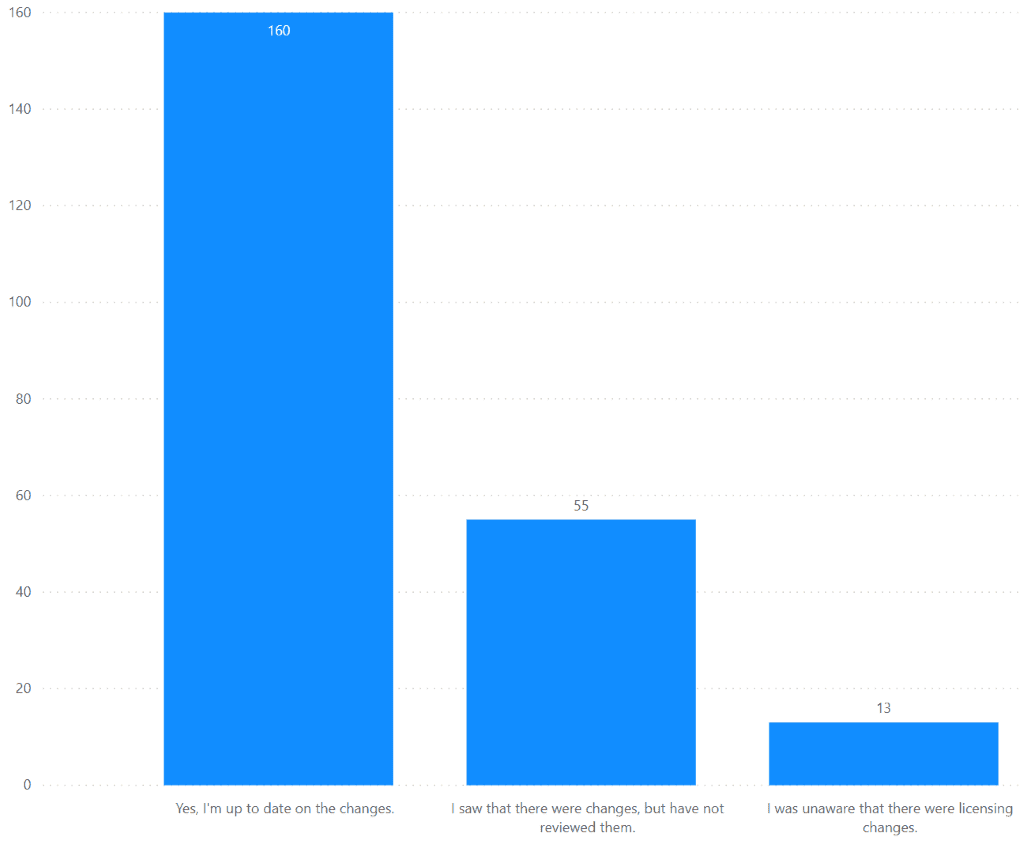
Figure 3 – Familiarity with Licensing Changes
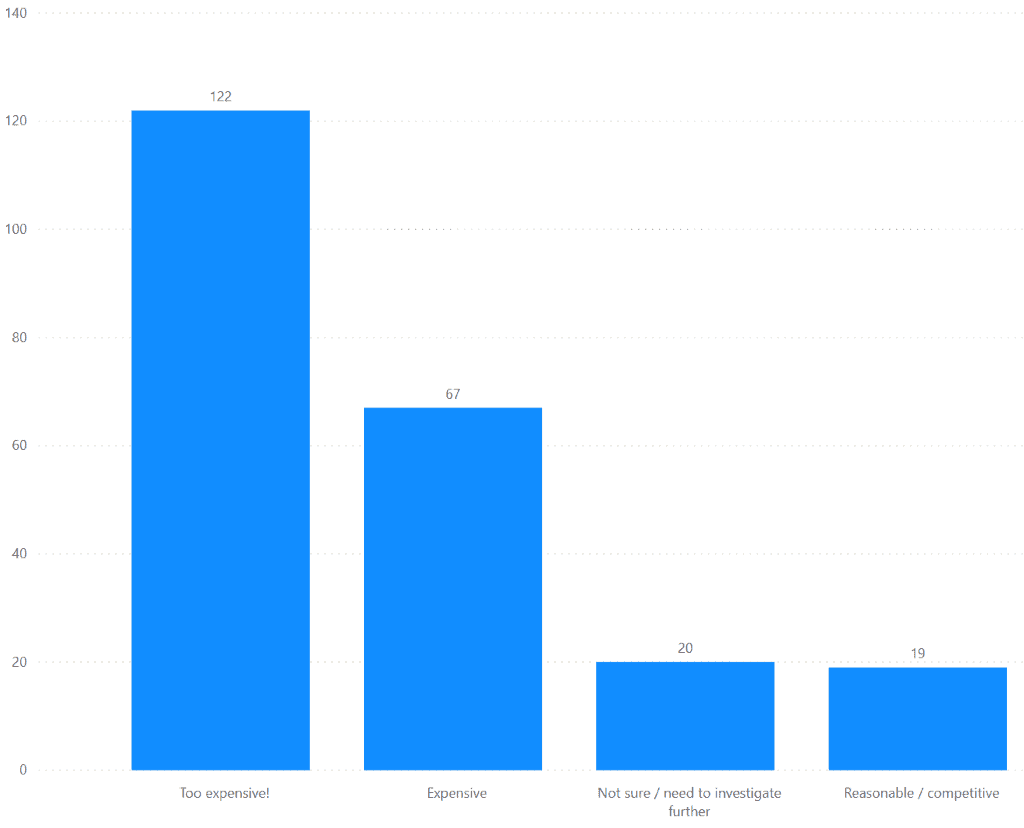
Capturing actionable data around pricing for such a short survey is difficult, at the very least, but we felt it was important to at least gauge some basic sentiment. We asked respondents to share their “overall thoughts” on the price points of Power Apps and Power Automate pricing, giving them 5 options (in other words, a 5-point scale). As you can see in Figure 4, the majority felt that the latest pricing was Too Expensive (122 respondents) or Expensive (67 respondents), with no respondents selecting the 5th option of “Not expensive at all.”
Once again, we recognize that this feedback is completely subjective, and that some responses are based on the fact that the initial availability of these products (while in preview) was free – but as Mark and John discuss in the video, that is part of the “lessons learned” for Microsoft as they develop and release new products to be more transparent about future licensing plans. Based on further respondent feedback, expectation-setting would have impacted these results.

Beyond these quantitative measurements, we also wanted to give respondents an opportunity to provide direct feedback about how these licensing changes will impact their plans going forward. As shown in Figure 5, the most common impact was reported as “The changes will slow/halt our adoption internally.” This was the top response for organizations with 101 or more employees, with smaller organizations being split between “We will investigate alternate solutions,” “We will be conservative in our use,” and “Not sure – still trying to understand the impacts” which round out the top 4 responses across all respondents.
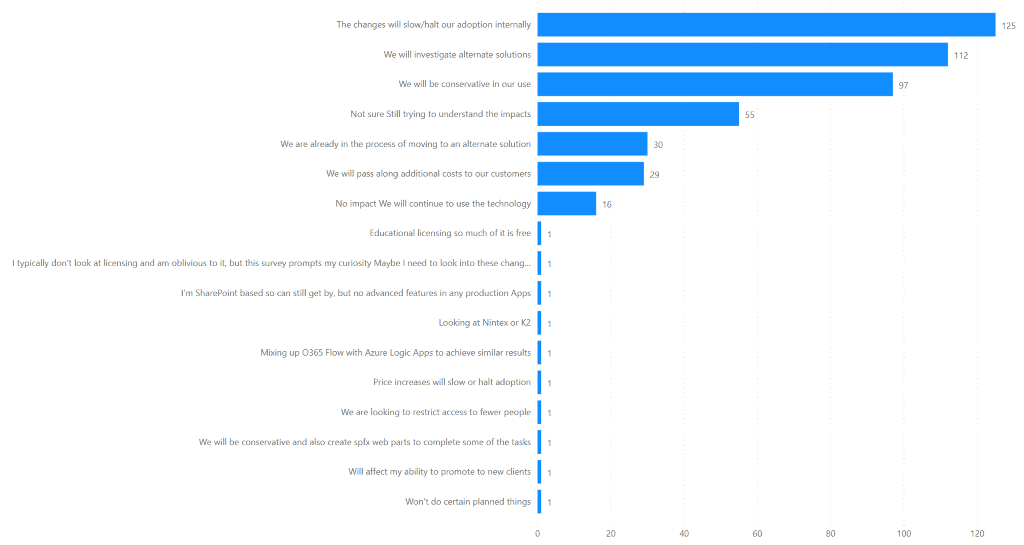
Figure 5 – Expected Impacts from Licensing Changes
When conducting these types of surveys, the quantitative measurements tend to garner the highest response rates, as was true for this survey. Asking respondents to identify impact on a scale of 1 to 7 is easy, but answering specific questions, in detail, to justify your response can be difficult. As a result, response rates for open-ended questions is generally low, and the quality of these responses can be poor.
Surprisingly, this was not the case with our survey. We asked two open-ended questions, and the majority of respondents provided feedback, giving us a wealth of information which Mark, John and I will write about in subsequent posts.
The first qualitative questions we asked was “What additional value would you like to see added to the Power Platform family, if any, to help offset the licensing costs? (e.g. specific connectors, missing features, etc).” The responses were diverse, ranging from the development of platform and industry-specific connectors (SAP, MongoDB, etc) to further simplification and streamlining of the licensing model. Figure 6 provides a tag cloud of the responses highlighting the most commonly used words and phrases.
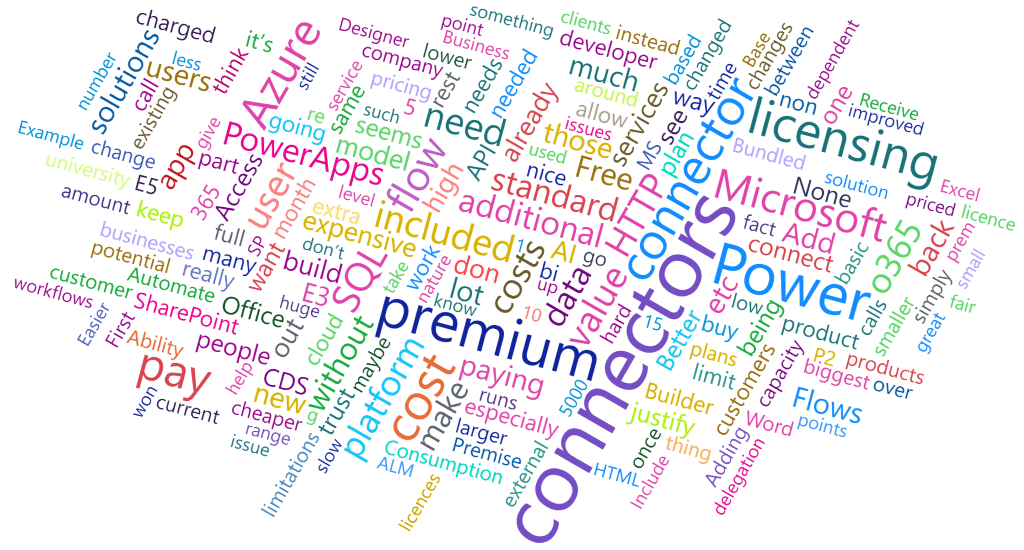
Figure 6 – Most Commonly Suggested Features
The final open-ended question asked was “Are you considering other solutions due to Power Apps and Power Automate licensing costs? If so, which tools are you considering?” From the tag cloud shown in Figure 7, there were recurring themes across several products and solutions, with many respondents stating that they were not yet sure about their path forward. Again, we will dig more deeply into these responses in future posts as there is too much to cover in this one summary post.
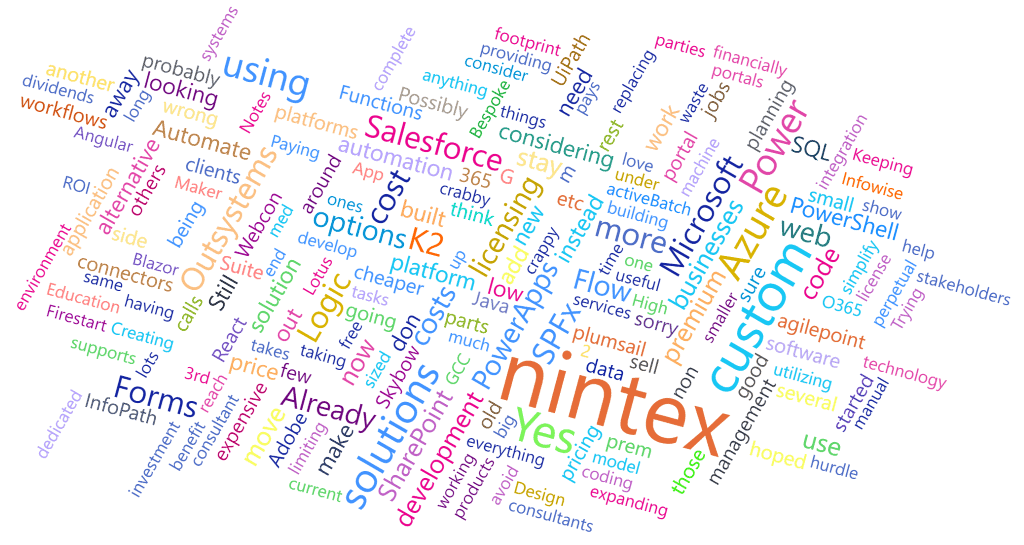
Figure 7 – Alternate Solutions Being Considered
Next Steps
In the coming weeks, Mark, John and I will further explore the results and share additional insights into the results once we’ve had time to further digest the data. All three of us are still on the road following #ESPC19, but as things settle down over the holidays, watch for additional blog and video content.
And to all of you who participated in the survey, thank you again for providing your feedback!