Its time to debug model driven and canvas apps!
Monitor Tool Overview
Using Monitor tool,
- Makers of canvas apps can view events while building a new app or to monitor published apps.
- Makers of model-driven apps can monitor page navigation, command executions, form-related issues, and other major actions.
Using Monitor with Model Driven App
Lets see step by step to use Monitor with Model Driven App.
- Connect to Power Apps Portal.
- Select the Model Driven App from either from ‘Apps’ tab or from ‘Solutions’ and select the ‘Monitor’ option from Command bar.
![[Step by Step] Debug Model Driven and Canvas Apps using ‘Monitor’ tool](https://www.sharepointeurope.com/wp-content/uploads/2021/03/Step-by-Step-Debug-Model-Driven-and-Canvas-Apps-using-‘Monitor-tool1.png)
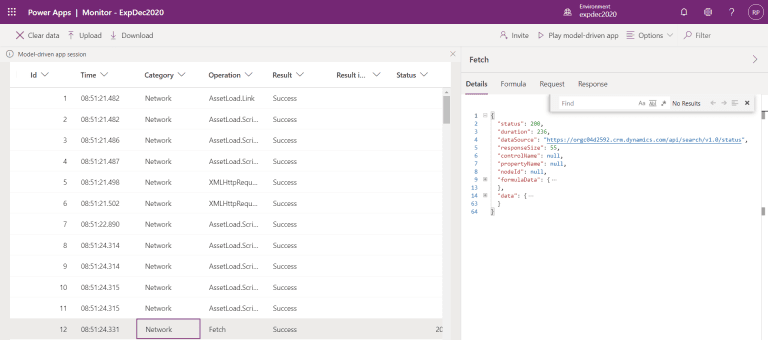
- A new Monitor session opens up as below in a browser tab.
![[Step by Step] Debug Model Driven and Canvas Apps using ‘Monitor’ tool](https://www.sharepointeurope.com/wp-content/uploads/2021/03/Step-by-Step-Debug-Model-Driven-and-Canvas-Apps-using-‘Monitor-tool2.png)
- Click on ‘Play model-driven app’ to start the diagnosis.
- After the app is opened from Monitor, you’ll see a Join monitor debug session? dialog box. Select Join.
![[Step by Step] Debug Model Driven and Canvas Apps using ‘Monitor’ tool](https://www.sharepointeurope.com/wp-content/uploads/2021/03/Step-by-Step-Debug-Model-Driven-and-Canvas-Apps-using-‘Monitor-tool3.png)
- A notification shows up to denote monitor is in progress.
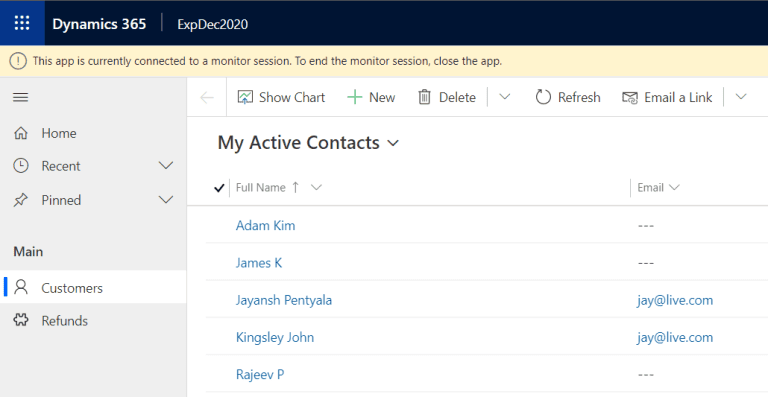
- While you navigate through the Model driven app, events begin to flow to the Monitor session screen.
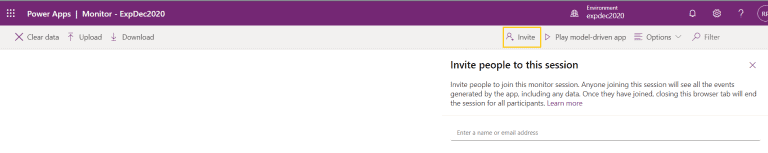
- You can also ‘Invite’ other to monitor the session.
Events monitored
Following are few events we can track in Monitor tool.
- FullLoad : Signifies the complete load of a page navigation, such as an edit form load. This event waits for certain network requests to complete and all rendering to finish, so the form can be ready before FullLoad completes.
- Network : Reveal details about each request made from the app.
- Page navigation, command executions, form saves, and other major actions will send key performance indicators and network events to Monitor.
- Script errors: Monitor receives events from the app with more details about the script errors, so you can debug more quickly, and easily.
Using Monitor with Canvas App
Using Monitor, we can trace events as they occur in a canvas app during the build, or we can use Monitor to debug the published version of a canvas app.
Monitor Canvas app during the build
- Open the Canvas app using ‘Edit’ option.
- From the ‘Advanced Tools’, select Monitor -> Open monitor.
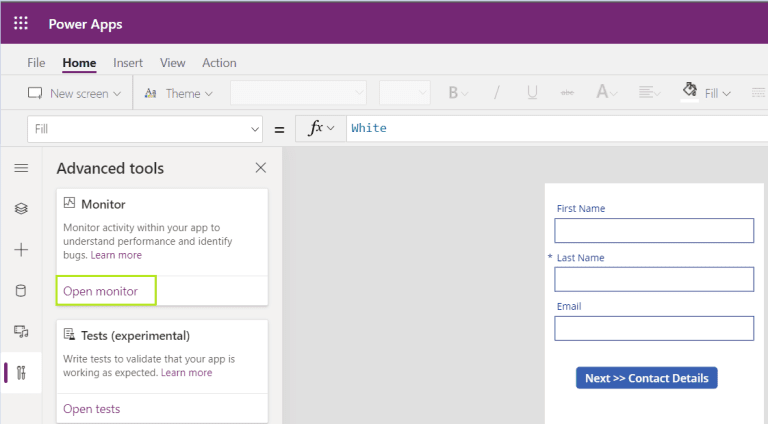
- A new browser tab opens Monitor screen and connects it to your existing Power Apps Studio session. A notification appears as “Studio Session”, which denotes its Canvas app during build.
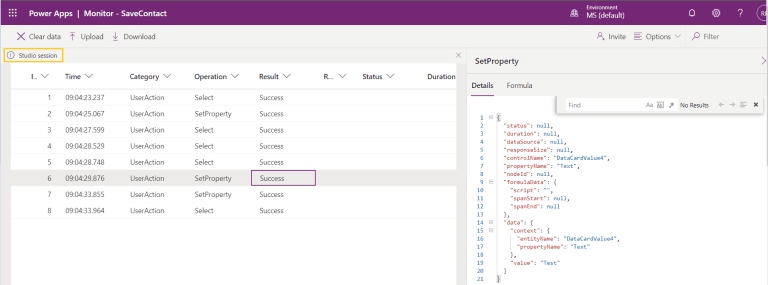
- Run the ‘Canvas’ app and you would see the events logged as below.
Monitor Published Canvas app
- Select the App and select ‘Monitor’ Or, you can select More Commands (…), and then select Monitor.
![[Step by Step] Debug Model Driven and Canvas Apps using ‘Monitor’ tool](https://www.sharepointeurope.com/wp-content/uploads/2021/03/Step-by-Step-Debug-Model-Driven-and-Canvas-Apps-using-‘Monitor-tool9.png)
- A new browser tab opens Monitor screen. Click on ‘Play published app’.
![[Step by Step] Debug Model Driven and Canvas Apps using ‘Monitor’ tool](https://www.sharepointeurope.com/wp-content/uploads/2021/03/Step-by-Step-Debug-Model-Driven-and-Canvas-Apps-using-‘Monitor-tool10.png)
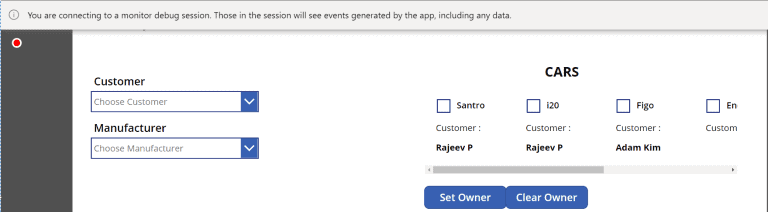
- This action opens the published app in a new browser tab and connects it to your current Monitor session.
- You would notice a banner and record kind of icon at the top.
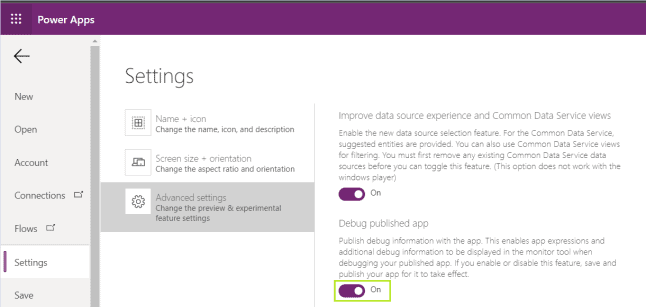
- To view the source expressions in Monitor for the published app, you need to turn on the setting to publish the expressions with the app.
Notes:
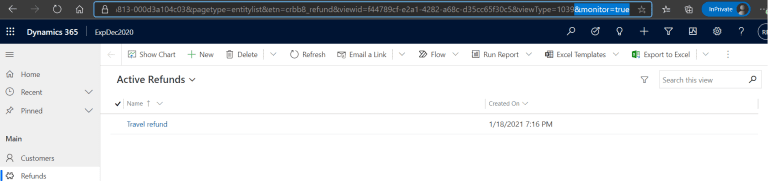
- You can run a model-driven app and add “&monitor=true” to the end of the URL in the browser. Then, select Monitor on the command bar to start a monitoring session in a new tab.

I am Rajeev Pentyala, A Master’s Degree holder in computer applications from India and a Certified Microsoft Professional.I have been working on Microsoft technologies such as Dynamics 365 CE, Dynamics CRM, Dynamics Portals, Power Platform, USD, ADX, ASP.Net, C#.Net, SSRS and SSIS.
Reference:
Pentyala, R. (2021). [Step by Step] Debug Model Driven and Canvas Apps using ‘Monitor’ tool. Available at: https://rajeevpentyala.com/2021/01/26/step-by-step-debug-model-driven-and-canvas-apps-using-monitor-tool/ [Accessed: 4th March 2021].
Find more great Power Platform content here.