So you’ve made the decision to migrate from one version of SharePoint to the next. Perhaps you’re taking the big step to migrate to Office 365. As daunting as this process may seem at first glance, there are a myriad of ways to manage and take control of your SharePoint or Office 365 migration. This can include the implementation of a number of third party tools that physically migrate content for you. But have you thought about how analytics can also help to ease your SharePoint migration? A high quality analytics solution can help you to ease the migration process by tracking and analyzing each step of the process.
Migration Challenges
 What challenges are associated with the migration process? Identifying the potential challenges is the first step to beginning a successful migration. By anticipating weak spots within the portal and how they relate to migration, you can begin to understand how to plan your migration.
Planning– The first step in any migration process is planning. Is there a clear plan of the migration process? Where is the clear plan located? Are there steps in place to ensure that the migration is implemented in a step-by-step manner? These are all important questions to ask yourself because differentiating between a successful migration and an unsuccessful migration can be distinguished with clear planning in place.
Testing– Have you emplaced testing before your migration? Many organizations don’t do actual testing before the actual migration process begins. By testing small areas of content, specific sites, or small web locations, you can assess the migration in those areas before you do it across the entire farm. This can give you an idea of how your migration process will go before you actually implement it on a grand scale.
Tools– There are a lot of third party tools that can assist you in doing the dirty work of actually physically migrating your content from one version to the next. However, a third party analytics tool is advantageous in order to assess the environment before the migration tools can take over.
Why Analytics for Migration?
It’s been said before, but I’ll say it again. You can only manage what you measure. It’s very common that organizations don’t have a concrete understanding of what’s going on with their migration process. There may be a “feeling” of what’s going well and what’s not, but factually it’s not possible to say what exactly is happening. This is where analytics can assist in measuring migration in all of its steps.
Prior to Migration
Unused Content– Generating reports for unused content is helpful for detecting hundreds and thousands of site collections that have not been accessed. Detecting unused sites is also important for organizing and minimizing the amount of content you migrate. Reports can detect lists, libraries, and list items that are not popular, videos that havn’t been watched, and documents that are not being used. You can find out where these pieces of content are, and decide whether you want to migrate them.
Navigation– Say an organization wants to create new pages, like a home page, for their new intranet. Will they use the same navigation bar that was used in the previous version of SharePoint? What if there are links and buttons that people just aren’t clicking on. On a home page, the space is quite limited. This means that it’s important to link to the most popular content for the users. By generating Most Popular Content Reports, you can determine what aspects of the SharePoint pages you would like to migrate, and which aspects are no longer relevant to the users. This ensures that you can build a better navigation tool within the new environment.
During Migration

Unique Users– Reports offering insights on top users in the new environment can be an effective resource for knowing who to empower. You can easily turn these top users into evangelists or site owners because you know from your metrics that these are the most active people in those specific environments.
Unique Groups Reports- With Unique Groups Reports, you can approach groups based upon the those who are sharing less than other and allocating training budgets in a better way to target them because they are using the portal less than other groups..
After Migration
Adoption of the New Portal– The biggest challenge in any migration is making sure people are utilizing the new tool. A large amount of time, effort, and budget is dedicated to purchasing new licenses, migrating content, and training users. Now there is a need to show that users are leveraging the new portal and that there is a return on investment from the migration.
Surveying Tool– Utilize a surveying tool to ask users what are their challenges. What do they need from the portal? What would they like to see in this new version? The surveying tool can collect real time feedback from users as they experience SharePoint.
Groups Activity– Creating a Groups Activity Report can give you an idea of what groups are active and engaging with content and users, and which ones are not.
A wealth of other types of reports can be utilized at this point to measure the success of new navigation, monitor new applications including search and my sites, and to track individual applications as well. Analytics are vital throughout all stages of the migration process. By becoming aware of the challenges within the migration process, you can take your SharePoint migration process by the reigns to ensure the new version is optimized for adoption, collaboration, and engagement of your users.
A third party solution that offers all of the features mentioned in this post is CardioLog Analytics.
This blog was provided by INTLOCK, developer of CardioLog Analytics. CardioLog Analytics has been a leader in the field of SharePoint analytics since 2005. CardioLog Analytics is a premier solution specifically designed for SharePoint, and the only on-premise SharePoint Analytics solution for enterprises and governments. CardioLog Analytics enables you to improve the usability of your intranet, drive portal collaboration, boost user engagement, and enhance the overall productivity of your business. It provides on-demand (SaaS) and on-premises analytics for Yammer, Sitrion, SharePoint 2013, 2010, 2007, 2003 and SharePoint Online. For further information about this topic and others, please register to our upcoming webinars.
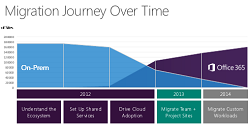
Migration Journey Over Time