At the recent 2017 European SharePoint, Office 365 & Azure Conference in Dublin, my colleague @VelinGeorgiev and I built a solution for the conference hackathon that uses insights gathered from machine learning to create communities of users on an Office365 tenant who have similar behavior.
I came up with the idea and built the machine learning part of it. Velin built the collaboration logic using SharePoint, Forms and Flow. He blogged about that portion on his blog and we won the Hackathon!
Congratulations to the #ESPC17 Hackathon winners Velin Georgiev and Joon Du Rant from Pramerica, Ireland and well done to all who took part! pic.twitter.com/5yceQS7uON
— European SharePoint (@EuropeanSP) November 22, 2017
The Idea
I have been working in the team that develops collaboration solutions for a very large US company. We deliver collaboration solutions on a few platforms, one of them being Office365: using SharePoint Online as the backbone, but also utilizing other Office365 services like Flow, PowerApps and PowerBI and Microsoft Azure services for additional customization.
Office365 tracks most actions in most of the services, and writes out log entries for every action performed by every user. This data includes things like which workload (SharePoint, Email, OneDrive, PoweApps, Flow, etc.) the action occurred in, what the action was and when it was performed.
This is very useful for auditing and security, but I have been thinking for a while about how we could use the Office365 audit log data for machine learning applications.
One of the issues I’ve been thinking about is how an Office365 tenant owner can identify communities of users on a tenant. In my organisation (and I suspect in most other organisations) user communities are created from assumptions. Alternatively, users are all treated the same and given the same content and training.
Wouldn’t it be useful if we could find communities of people by their behavior? We could discover which people use advanced features, which people are struggling, who helps other people, who are administrators, and many other groups of behavior.
I thought that it would be interesting to combine the log data in Office365 with some machine learning and see what we can do.
Approach to machine learning
The part of this project where I feel like I have the most left to learn is definitely the analytics part. I found this awesome series of videos where Microsoft addresses data science noobs like myself and explains the foundations of data science and how you can use Azure Machine Learning Studio. Armed with the knowledge that the type of problem I want to solve is a clustering problem, I spent some time in the Azure Machine Learning studio samples seeing how other people approached clustering projects.
Based on what I learnt there, I decided that I would try an unsupervised learning algorithm (K-Means clustering) on the log data and see how that works out. I decided that the dataset I would use for the clustering is a matrix of users, with the count of each type of action per user in the tenant.
Getting log data
The easiest way to analyze the query data from your Office365 tenant is to use the Azure Log Analytics tool. You have to use an Azure subscription, then once you have created your analytics workspace you can install a plugin that will forward all log data from the Office tenant to the log analytics solution:
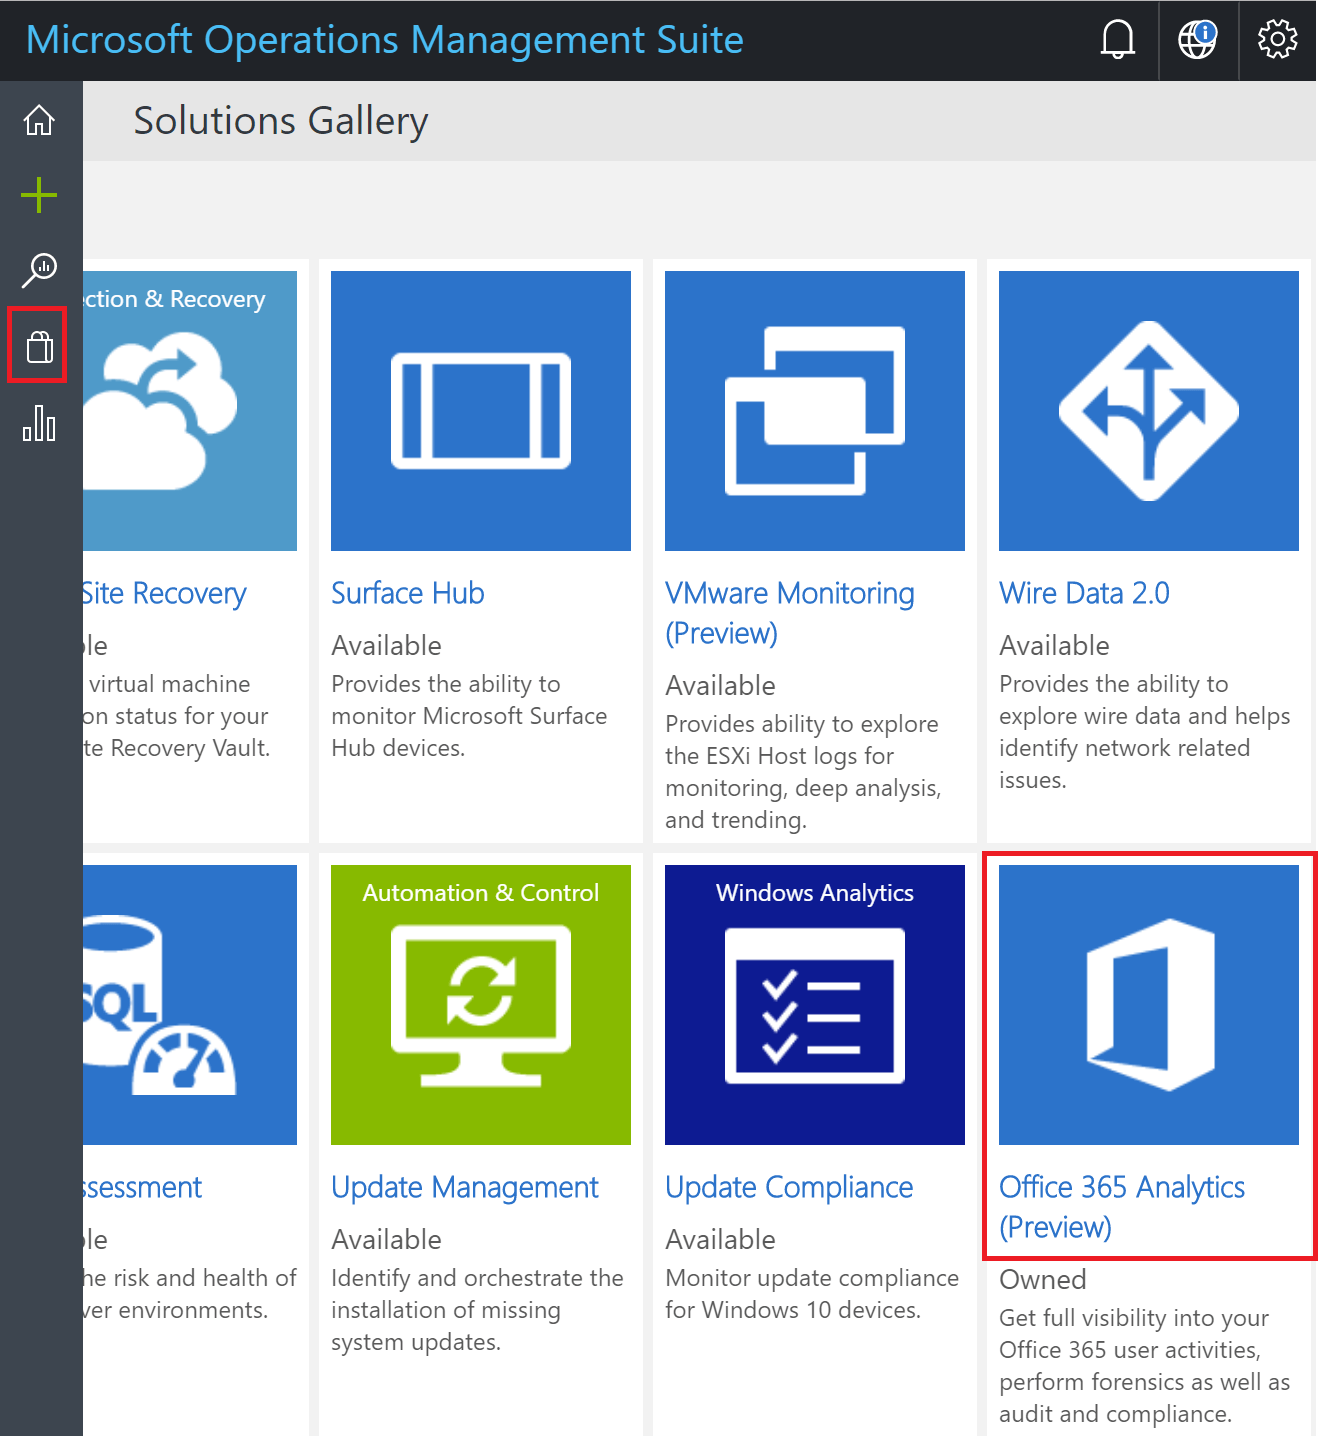
Using Azure Machine Learning to understand user communities on Office 365 – Azure Log Analytics tool
Once you have the log analytics plug-in aggregating the data, the next step is to inspect that data, and figure out what the activity on your tenant looks like. I used a simple query to pull in the list of distinct actions that have been performed in my tenant:
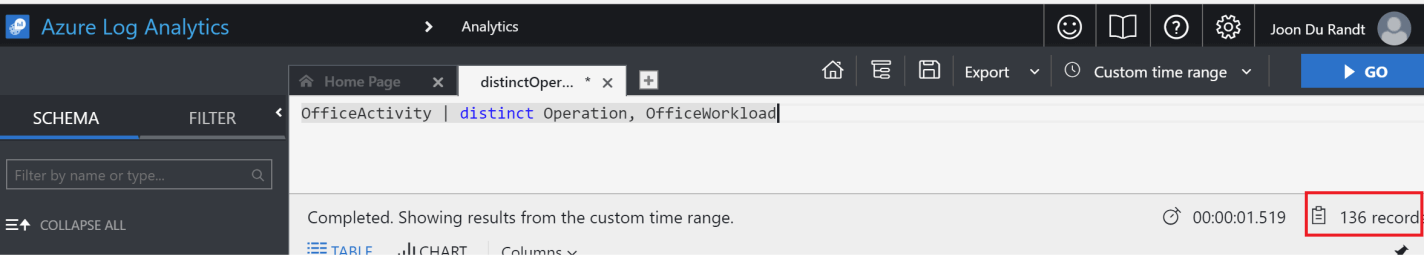
Simple query to pull in the list of distinct actions that have been performed in my tenant
You can see from the above that I had 136 different operations performed on my tenant. This is way too many dimensions for the clustering algorithm to work properly, so I used Excel and mapped those 136 activities into similar groupings, so I could aggregate into 15 groups of actions that are related. I had the following categories of activity:
- General Usage
- Azure Development
- Directory Administration
- Mail Administration
- Email Usage
- OneDrive Usage
- OneDrive Advanced Usage
- Development
- SharePoint Usage
- SharePoint Content Creation
- SharePoint Administration
- SharePoint Content Access
- SharePoint Advanced Content Creation
- SharePoint Site Administration
- SharePoint E-Discovery

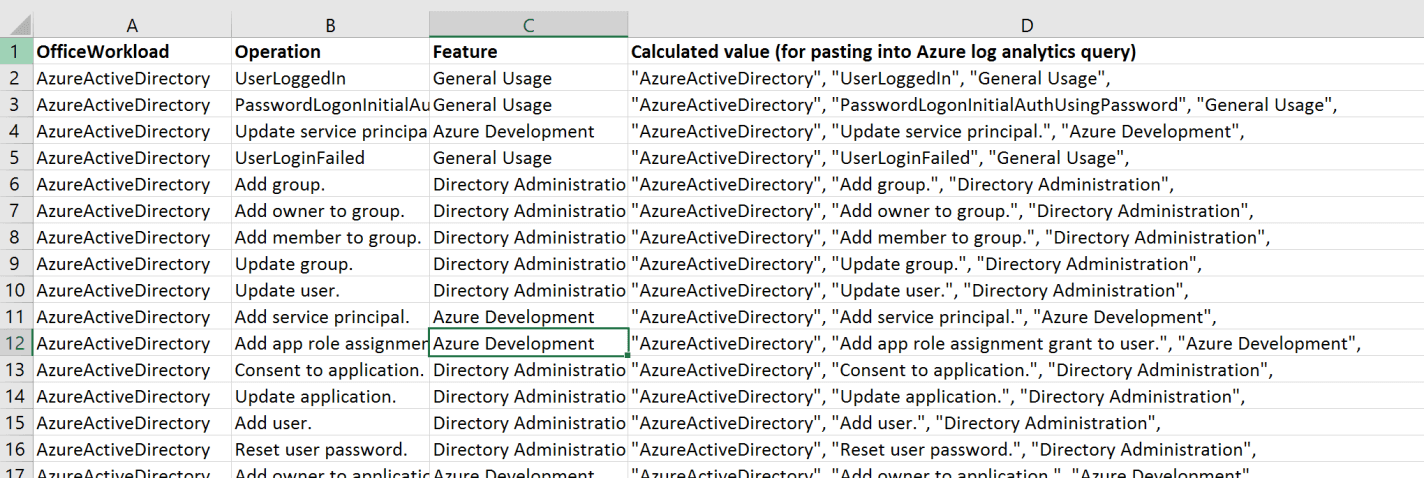
Machine Learning can often start with a Spreadsheet
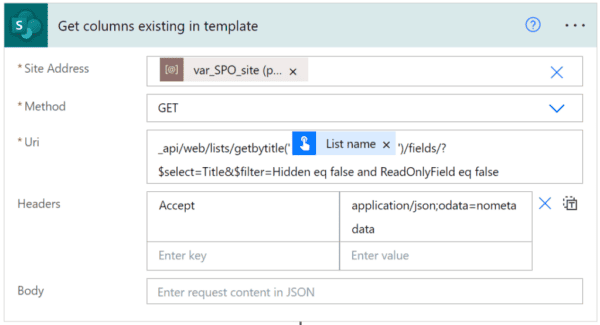
Once I had my mapping table, I used a log analytics query to count my revised set of actions for each user. Log Analytics allows you to project an arbitrary table and join that to analytics data in the portal. This is what that query looked like:
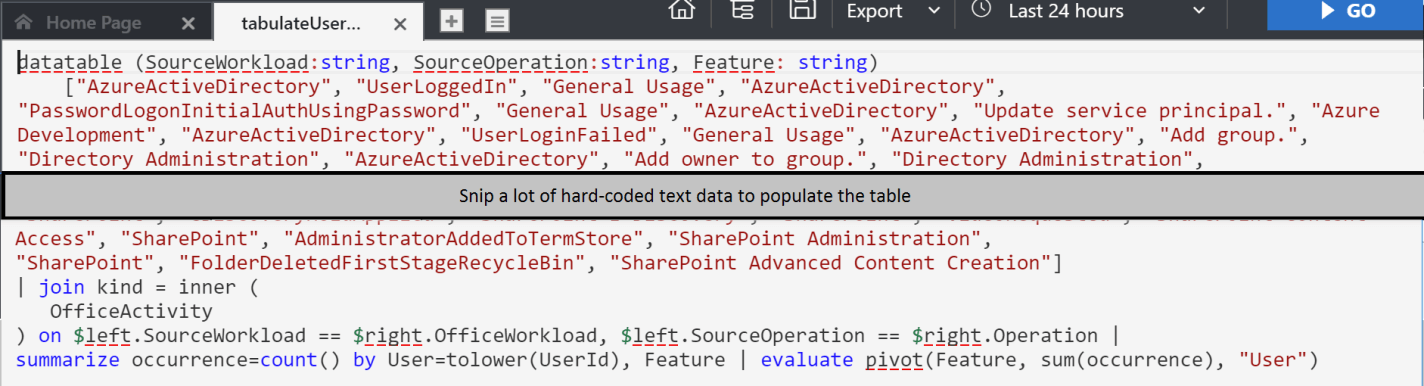
Log analytics query
This query takes the list of operations that we have copied and pasted from Excel, uses the “datatable” function in log analytics to turn that data into a table, and then joins this table to the office log records. It counts occurrence per activity per use, and then uses the “evaluate pivot” feature to create the matrix with user running down the left, and count by revised user action across the top. This is what the result looks like:
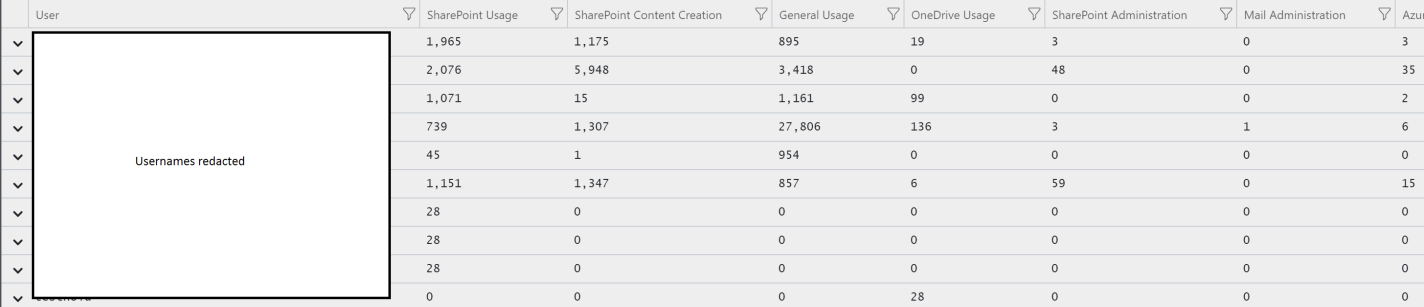
Evaluate pivot
Clustering the data
Once I had the data, I needed to filter it so that one type of action didn’t interfere over another type of action. Because some types of action (AD login, for example) occur a LOT, the clustering algorithm would ascribe them higher value, even though the don’t necessarily mean anything special. To fix that, I used Excel and ran some formulae on the data that I had in order to normalise all counts within columns.
I normalised the data by using this formula: normalised(x) = (x−mean(x))/std(x).
Using this approach I ended up with a dataset where every column had data that was still as different from other cells within the same column as it was to start with, but where the data across the columns was now normalised so that they would appear equally important to the clustering algorithm.
I created an Azure ML workspace that ran the K-Means clustering algo on our data. Here is what it looked like:
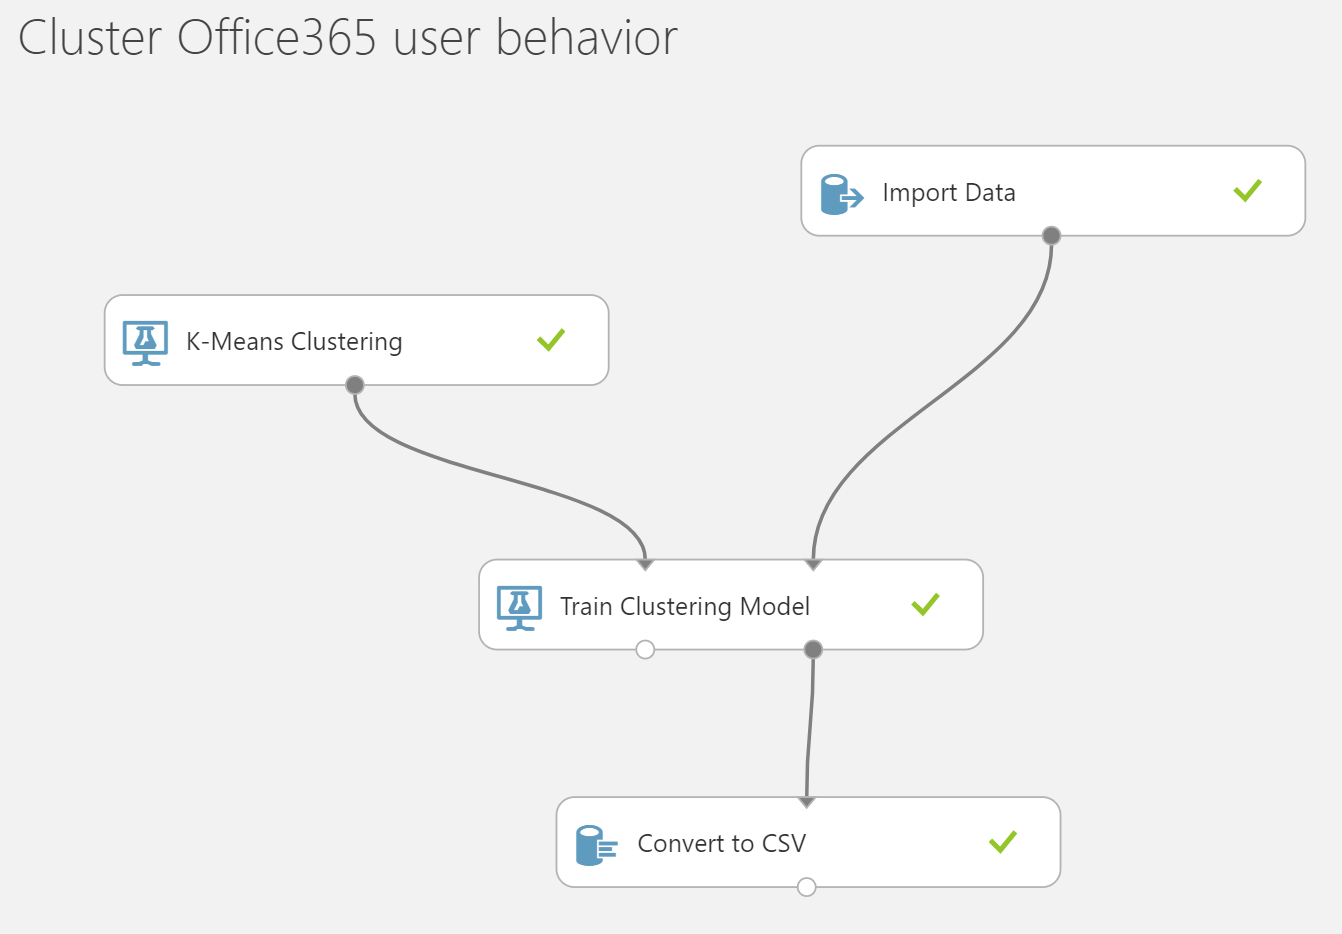
Azure ML workspace that ran the K-Means clustering algo on our data
The CSV Output from the clustering algorithm is a file containing all of our users, and the cluster that they are most associated with, as well as a measurement of how close they are to the other clusters.
Surveys and Yammer Groups
Note that at this stage we don’t know what type of user is in a cluster, we just know that this is a group of statistically similar users on the Office tenant. The next step was to upload this CSV file into the user facing part of our hack, where Velin built a SharePoint site where we could survey the users (Using MS Forms) and figure out what the clusters are using PowerBI.
Velin created a process where we could add the users to Yammer groups for them to collaborate, once we had figured out what the groups are in the survey.
Reference:
Joondurandt, V. (2017). Using Azure Machine Learning to understand user communities on Office 365. [online] Joon’s software learnings & leanings. Available at: https://joondurandt.wordpress.com/2017/12/10/azure-machine-learning-find-user-communities-on-o365/ [Accessed 12 Dec. 2017].