Power BI has direct support for reporting on SharePoint lists and documents whether SharePoint is on-premises or in the cloud. Getting at your data is relatively straightforward if you know the URL, but as I’ve written about before, SharePoint data can be idiosyncratic. Text and number fields work right away, but more complex data types require a little more thought, and this is certainly true of multi value fields.
Multi value fields are really SharePoint’s way of approximating the behavior of a one-to-many relationship of a relational database. SharePoint can store list-based data, and even though it has the concept of a lookup field, it is not a relational database. Chances are however that if we’re reporting on this type of field, we want it to behave as though it were. Fortunately, Power BI gives us several options for doing this.
The List
Consider the following list that contains a multi-value choice field named Amenities:
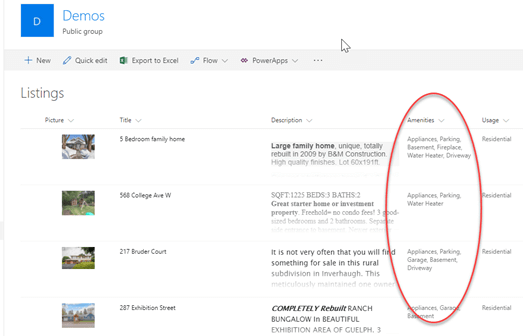
Listings

Amenities list
In the view, the different values are flattened, and displayed as a single value using a comma to separate them. How do we go about reporting on this data in Power BI? There’s no right answer, as it depends on the report requirements, but there are several options. In all cases the data first needs to be brought into Power BI Desktop.
Loading the Data
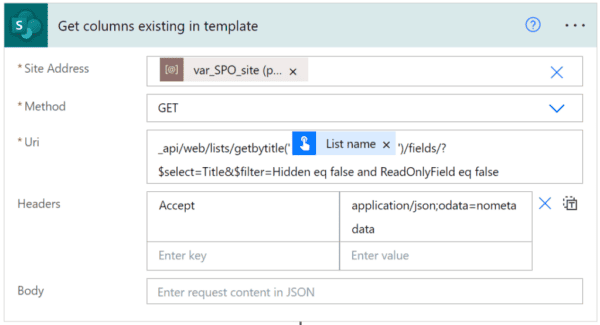
We first launch Power BI Desktop, select “Get Data” and then choose SharePoint Online list (if connecting to SharePoint Online) or SharePoint List (if using SharePoint Server). We are then prompted for the URL of the SharePoint Site. The dialog is titled SharePoint lists, but the value is actually the URL of the site, NOT the list itself. Once this is entered we are prompted for credentials if we haven’t connected to this site before. After entering credentials, we can select the list that we want to report on. In our case, it’s named “Listings”. We select it, and then click on the Edit button.

Power BI Desktop
Once the data loads in, one of the first things that you’ll notice is that there are a lot of columns to choose from, and it’s a good idea to remove the data that you don’t need. In this case, we can remove the ContentTypeId column and everything to the right of it, with one important exception We want to keep the FieldValuesAsText column (we’ll come back to that shortly). Remember, for our purposes here, we want to report on the multi-value column, Amenities. The simplest way to represent this data is as a string of comma separated values, which is the same way it is shown in a SharePoint view. It is also possible to use this data in a more sliceable, or structured way. Let’s start with the simplest.
Extracting a Simple Text Field
If our report is to show all the amenities associated with a listing, then a simple text string will do the job. Examining the data in the Query Editor, you will notice that there are no values displayed for Amenity, the way that there is for simpler field types like “Sold” or “Asking Price”. Instead, each cell contains a “List Value”. Each of these Lists contains the Amenities values for each record and clicking on one will extract those values for that one item. However, of we want to extract the values for all items, so we need to expand the column by clicking on the expand icon in the column header.

Data table
We are then given two options, “Expand to New Rows” or “Extract Value”. To extract the values into a single value, we select “Extract Values”

Extract Values
We are then given the opportunity to choose a delimiter, and after that the values in the column are replace with simple text values.
Another way to accomplish this same thing is to use the FieldValuesAsText column (referenced above). The fields in this column contain a single record containing the textual values for all the complex data types in a SharePoint list. If you are doing reporting with SharePoint data in Power BI, FieldValuesAsText is your friend. To use it, we just click the expand icon in its column header, deselect all of the columns that we don’t need (which in our case is everything except Amenities) and click OK. We are returned the contents of the list in a comma separated string for each item.

FieldValuesAsText column
At this point, we can report on the data.
We click on Close and Apply in the ribbon to return to the report canvas. We add a table visual, and add some of the fields like address, street number, and Amenities to it. You’ll see that the table looks much like it would in a SharePoint list. Next, we add a slicer to the report page, and use one of the other columns, like City. Clicking on a city will filter the table by that city as expected. Now, if we want to filter by Amenity, we can add the Amenity column to the slicer, but it won’t behave the way we want it to. Each combination of amenity values will be represented as a single value. We are unable to slice on a single value like “Garage”.

Flattened multi value field as slicer
To use discrete values for our multi-value field, we need to do a little more work in the Get Data (Power Query) interface.
Extracting Discrete Values from a Multi-Value Field
We follow the initial steps from the “Simple Text Value” section above, but when the expand icon is selected, we select “Expand to new rows” and NOT “Extract values”. When this is done, each row will be copied to accommodate all of the individual Amenity values. If there were 3 Amenity values, we wind up with three rows of identical values, but with each of the values for Amenity.

Expanding to new rows

We can now go to the design surface and add a table, and a slicer that uses the multi value column, and now we can filter on discrete values. This may be sufficient in many cases. However, if we create a measure that based on an aggregate value for the table (like COUNTROWS or SUM), the value will not be correct if there are no slicer values. It works with all of the duplicated rows.

Incorrect number of listings
Again, this approach may work in many situations, but for ultimate flexibility, we need a true one-to-many relationship. Luckily, Power Query gives us a few simple tools to do this.
Creating a One-to-Many Relationship
Again, we follow the initial steps from the “Simple Text Value” section above, but do not click on the expand icon in the Amenities column. A One-to-many relationship requires at least two tables, so now is the point where we need to add a second one. We do so by copying the first. We right click on the query in the Queries pane and select “Duplicate”.

This creates a second query identical to our first, which will load into another table. We can then give the new query a better name, like “Amenities” in our case. Next, we select the Id, and the Amenities columns, right click and select “Remove Other Columns”, and we are left with only the ID and Amenities columns. Now we select the expand icon and select “Expand to New Rows”.

We now go back to the original query and remove the Amenities column. The result is two tables, Listings and Amenities, with Listings containing the bulk of the information. We then click on Close and Apply in the ribbon to load the data into the model, and the relationships icon to take is to the relationship builder. We need to establish a relationship between the two tables, and we do so by clicking on the Id field in one table and dragging it to the Id field of the other. Finally, double click on the relationship line between the tables, and be sure to select “Both” for Cross Filter Direction – that way Amenity values can filter List values. If “Both” is selected, the directional arrow will point two ways.

Now, the same visuals from above can be added using the Amenity column from the second table as a slicer, and everything should work as expected. Listings will be filtered by the value, if no amenities are selected, the correct number of listings will be shown In the data card, and no duplication will appear in the table.
SharePoint multi-value columns are an attempt to replicate the capability of a relational database. With a few simple steps, Power BI can take SharePoint data, normalize it, and analyze it as if it were a true relational database.
Reference:
White, J. (2018). Using Power BI to Report on Multi-Value SharePoint Fields. [online] Available at: https://codecraft.tv/blog/2017/09/07/angularjs-to-angular-using-iframes/ [Accessed 16 Mar. 2018]