Lower Log Analytics Cost with Serverless

With the recent capability of setting retention period for Log Analytics data per table a lot of new possibilities of managing and retaining your data pop-up. A common scenario is that you may have a lot of performance data which may be logged every minute or even every 10 seconds. You need that data in such short intervals in your Log Analytics workspace only for the past month or so but you do not need such granularity for older data. At the same time it is good to have some summarization (aggregation) of that data for longer period due to compliance, analysis, etc but there is a cost associated when you retain a lot of data for longer period. By using serverless and the new per table retention capability now you can achieve this and save cost. In this blog I will show you how you can achieve this with simple example.

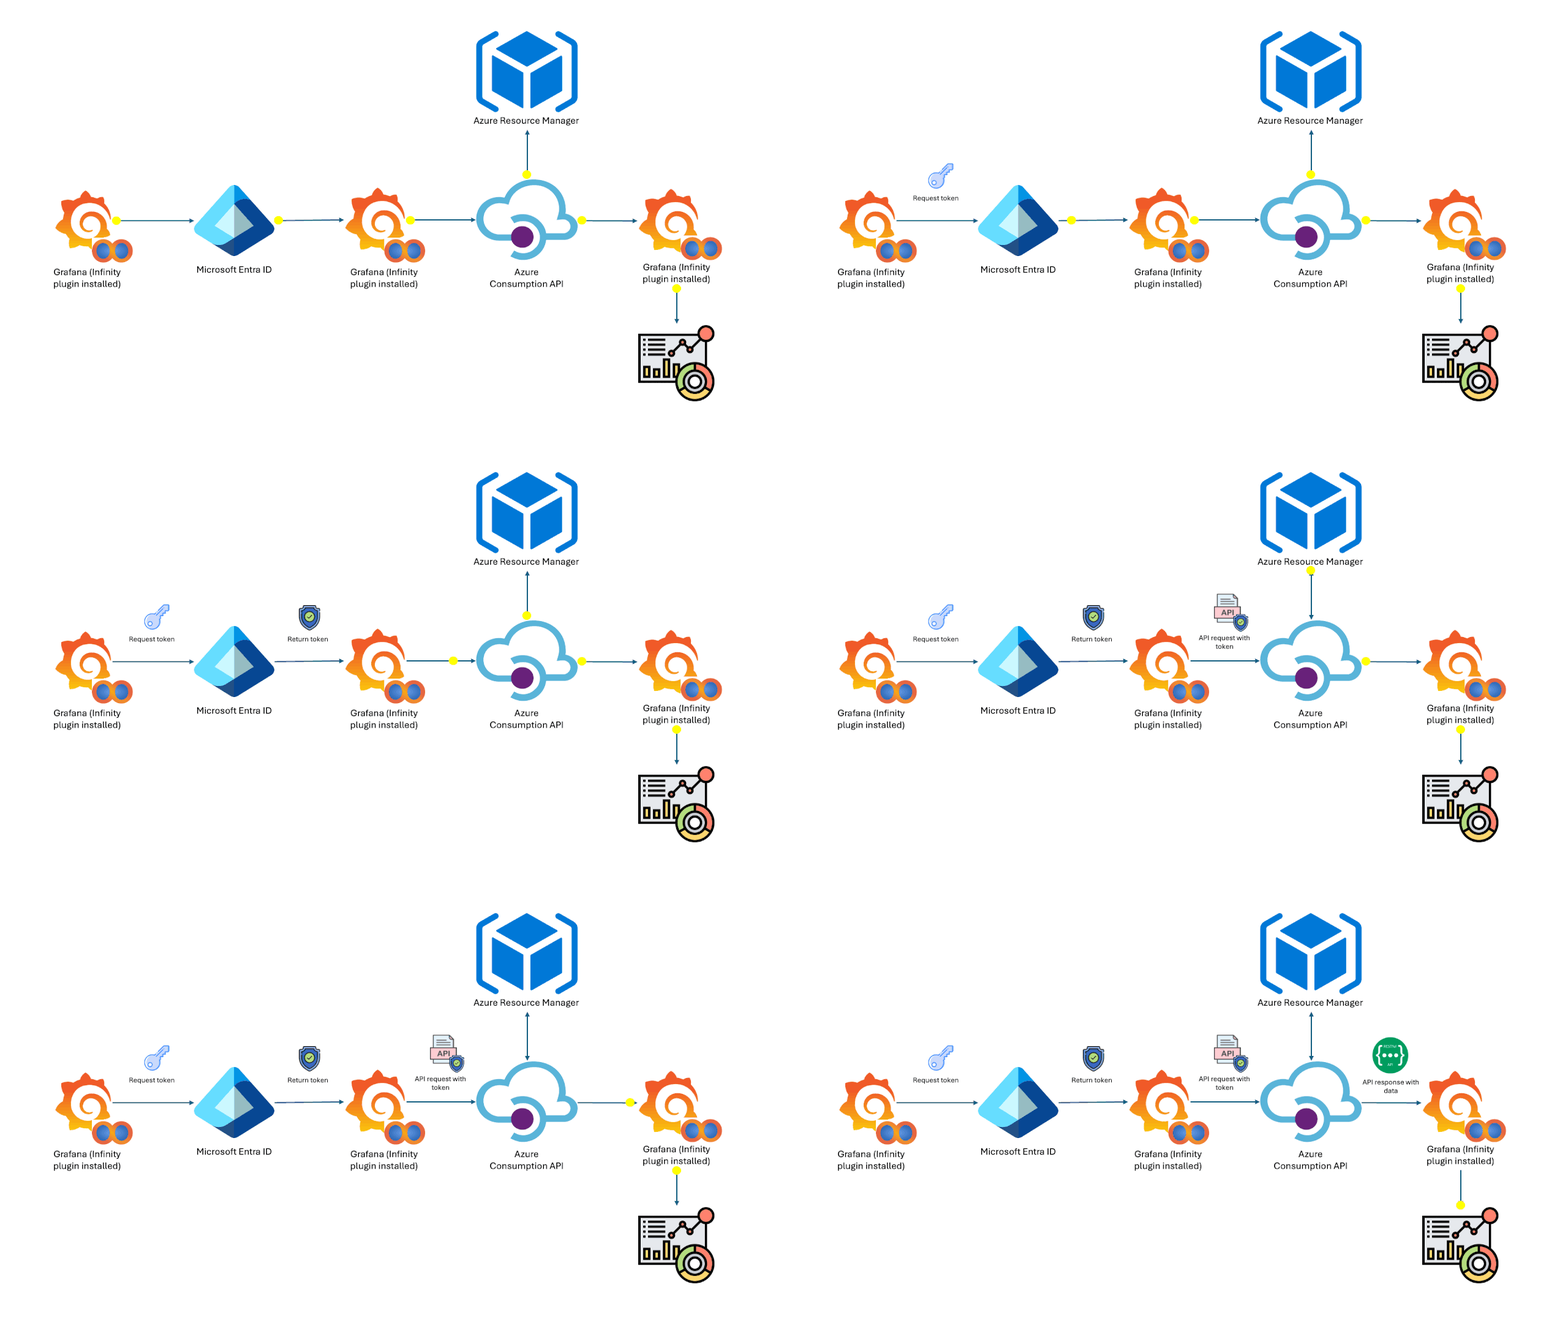
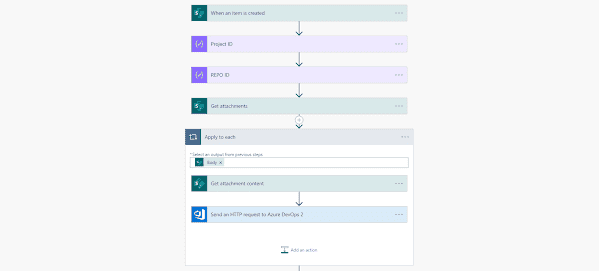
The way we are going to achieve this is very simple and it can be described in the following workflow:

  • We are going to develop an Azure Function that runs periodically or at trigger
  • The function will execute a query against our Log Analytics workspace
  • The query will basically gets summarized information of data
  • The returned data we will pushed into Log Analytics into a new table via Data Collector API
  • You can set higher retention for that specific table

The end result will be that we have a table in Log Analytics that is set with higher retention and contains summarized data that we can use as history.

You can find the full code for the function here. It is Visual Studio Code project which you can open and deploy with Azure Functions extension for VSC. I have intentionally used this format instead of ARM Templates so it is easier for folks who just start with functions to deploy it. Overall the main part of the code is in run.ps1 which looks like this:

using namespace System.Net
 
# Input bindings are passed in via param block.
param($Request, $TriggerMetadata)
 
# Write to the Azure Functions log stream.
Write-Host "PowerShell HTTP trigger function processed a request."
 
try
{
    $message = ''
    $workspaceName = '<the name of your workspace>'
    $workspaceResourceGroup = '<the name of the resource group>'
    $workspace = Get-AzOperationalInsightsWorkspace -ResourceGroupName $workspaceResourceGroup -Name $workspaceName
    $query = @"
        Perf
        | where TimeGenerated between (startofmonth( startofmonth(now()) -1d)..(startofmonth(now()) -1d))
        | where ObjectName == "Processor"
        | where CounterName == "% Processor Time"
        | summarize pct95CPU = percentile(CounterValue, 95), avgCpu = avg(CounterValue) by Computer, _ResourceId, bin(TimeGenerated, 31d)
        | extend TimeStamp = strcat( format_datetime((startofmonth(now()) -1d), "yyyy-MM-dd"), "T", format_datetime((startofmonth(now()) -1d), "HH:mm:ss.fff"), "Z" )
        | project TimeStamp, Computer, ResId = _ResourceId, pct95CPU, avgCpu
"@
    $queryOutput = Invoke-AzOperationalInsightsQuery -Workspace $workspace -Query $query
    $keys = Get-AzOperationalInsightsWorkspaceSharedKey -ResourceGroupName $workspaceResourceGroup -Name $workspaceName -WarningAction SilentlyContinue
    $logType = "PerfHistory"
    $timestampField = "TimeStamp"
    $queryOutput.Results | foreach {
        $jsonResults = $_ | ConvertTo-Json -Depth 5
        $requestResult = Send-OMSAPIIngestionFile `
                            -customerId $workspace.CustomerId `
                            -sharedKey $keys.PrimarySharedKey `
                            -body $jsonResults `
                            -logType $logType `
                            -TimeStampField $timestampField `
                            -ResourceId $_.ResId
        if ($requestResult -eq 'Accepted')
        {
            $status = [HttpStatusCode]::OK
            $body = $requestResult
        }
        else
        {
            $message += "Error occurred on uploading record: `r"
            $message += $jsonResults
        }
    }
    if ($message -ne '')
    {
        Write-Error -Message $message
    }
}
catch
{
    $body = $_.Exception.Message
    $status = [HttpStatusCode]::InternalServerError
}
 
# Associate values to output bindings by calling 'Push-OutputBinding'.
Push-OutputBinding -Name Response -Value ([HttpResponseContext]@{
    StatusCode = $status
    Body = $body
})

The function that I have created is triggered based on HTTP request but it is easy to convert the code to trigger on schedule. I do not have any specific body that is required for executing the function. You will have to though fill some details for your environment inside the function. Those are workpsace name and workspace resource group name. Let’s have a look at some of the main aspects of the code:

  • For this code I am using one modules – Az
  • I have pulled the functions from module OMSIngestionAPI and modified them so I can add _ResourceId to each record I send to Log Analytics. The modified functions are located in profile.ps1 file
  • I have a simple query that does the following
    • Takes the data from Perf table for the previous month. In this case we are now December and I am taking the data for November
    • Filters the data to specific counter like CPU Usage
    • summarizes the data by using two operators – percentile 95 and average
    • the data is summarized into a single record for the month
    • the date of the record is put the last day of the month and in ‘yyyy-MM-ddTHH:mm:ss.fffZ’ format. This is the format I need for sending it to Data Collector API
    • Several columns are projected:
      • TimeStamp – the date which will be put in Log Analytics for each record
      • Computer – the name of the server
      • ResId – resource id of the Azure VM
      • pct95CPU – percentile 95 CPU usage for the month
      • avgCpu – average CPU usage for the month
  • Each result of the query is send to Log Analaytics. This is needed so I can populate _ResourceId column for each record

I was tipped by Oleg Ananiev that you can use ingestion_time() instead of TimeGenerated. In such case the query will lool like this:

Perf
| where TimeGenerated between (startofmonth( startofmonth(now()) -1d)..(startofmonth(now()) -1d))
| where ObjectName == "Processor"
| where CounterName == "% Processor Time"
| summarize pct95CPU = percentile(CounterValue, 95), avgCpu = avg(CounterValue) by Computer, _ResourceId, bin(ingestion_time() , 31d)
| extend TimeStamp = strcat( format_datetime((startofmonth(now()) -1d), "yyyy-MM-dd"), "T", format_datetime((startofmonth(now()) -1d), "HH:mm:ss.fff"), "Z" )
| project TimeStamp, Computer, ResId = _ResourceId, pct95CPU, avgCpu

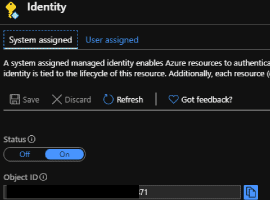
As you can see from the code the function is using managed identity to get access to Azure. In my case I am using system managed identity which I have configured on the function and gave contributor access to the resource group of the Log Analytics workspace:

Managed Identity on Function

Once the data is Log Analytics and the table is created it is good to set higher retention to it. When you query the data you will notice some things like:

Performance History Log
  • TimeGenerated is set correctly according to our TimeStamp value we have passed. It is set for the last day of the month.
  • pct95CPU_s and avgCpu_s contain strings rather doable. This problem is not caused by the Data Collector API but by Invoke-AzOperationalInsightsQuery cmdlet. It is a bug in that cmdlet that returns all the results from query as strings. I have logged that bug more than year ago but nobody has decided to fix it. You can workaround that problem with Kusto query language PerfHistory_CL | where TimeGenerated > ago(90d) | extend avgCpu = todouble(avgCpu_s) | extend pct95CPU = todouble(pct95CPU_s) by converting the data on the fly. Other option is to write your own cmdlet/function against the Log Analytics Search API so you can process the results on your own in correct format similarly to what my friend Tao Yang has done.
  • _ResourceId column value is logged correctly which means that if a user has permissions only for that VM or scopes Log search only to that resource it will have access to that data.

This is simple example that you can build upon for production. A few things to consider for production:

  • Improve error handling
  • Parameterize the function so may be you can make it general enough so you can even provide different queries to extract different data but use the same function for processing
  • Make sure that you do not hit any Search API or Data Collector API limitations upon execution or implement code that avoids these limitations

Depending on your case you might come up with other scenarios or improvements like:

  • Instead of logging history data monthly you can do it weekly or even daily
  • This solution can work even for event-based data for example
    • summarizing certain errors in a log – count, category, etc.
    • transferring only the errors from certain log into a new table
  • summarizing with more operators added – percentile 90, percentile 50, max, min, etc.

I hope you find this blog post useful!

About the Author:

I am Cloud Infrastructure Engineer at Sentia Denmark and 5 times Microsoft MVP. My favorite technologies are Azure, Azure Management and Security services (aka OMS), Azure Stack, System Center and Hyper-V. These technologies are the basics for Microsoft Public and Hybrid Clouds. I am trying to dive deep in them every day.

Reference:

Zhelyazkov, S. (2019). Lower Log Analytics Cost with Serverless. Available at: https://cloudadministrator.net/2019/12/11/lower-log-analytics-cost-with-serverless/ [Accessed: 10th March 2020].

https://twitter.com/EuropeanSP
Share this on...

Rate this Post:

Share: