Introduction
As explained in previous blog post, you can use the Kusto Query Language (KQL) for Anomaly detection and forecasting.
This is great for ad-hoc querying the logs, and visualizing the data with the metrics explorer. However, having a tool ready to explore the metrics is much better.
Azure Monitor Workbooks are the perfect tool for that.
For your convenience, I’ve created an example workbook.
Workbook
PARAMETERS
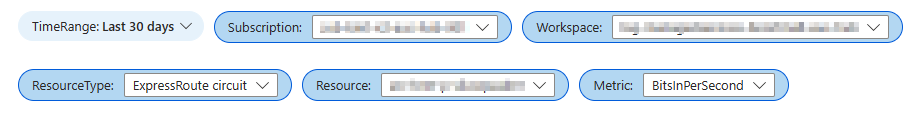
Timerange: The TimeRange
Subscription: The Subscription
Workspace: The Log Analytics Workspace
ResourceType: The Resource Type to filter out
Resource: The Resource Selected
Metric: The Metric
Aggregation: The type of aggregation (Avg, Min, Max, Pct5, Pct10, Pct50, Pct90, Pct95)
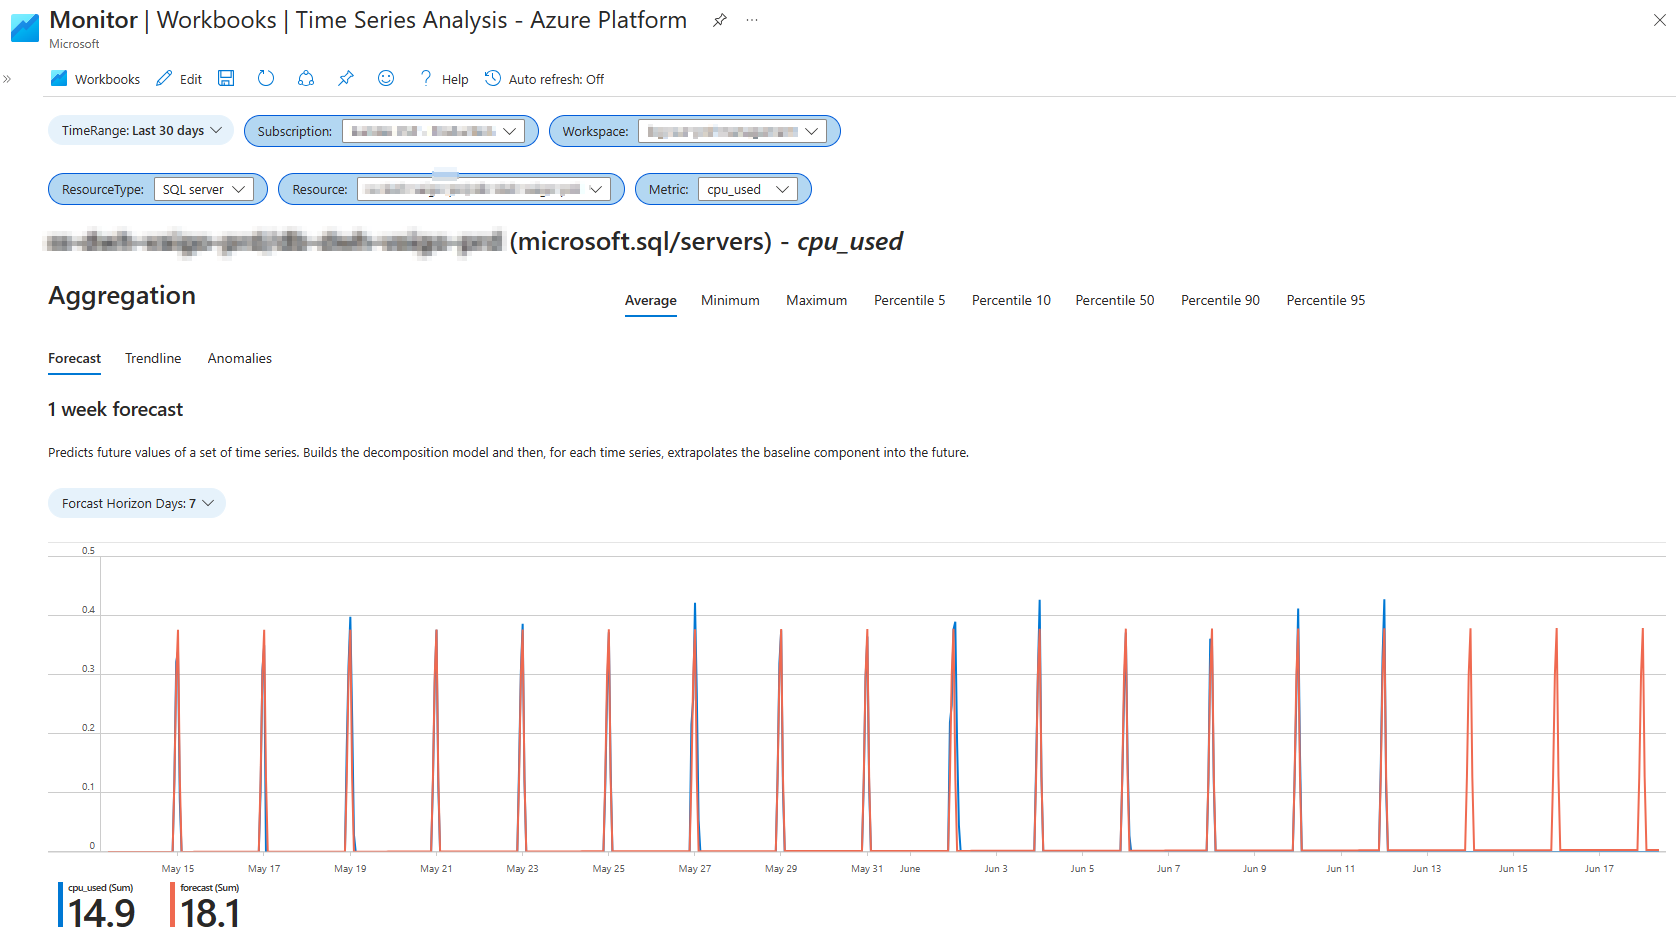
FORECAST
This is done using the series_decompose_forecast() function.
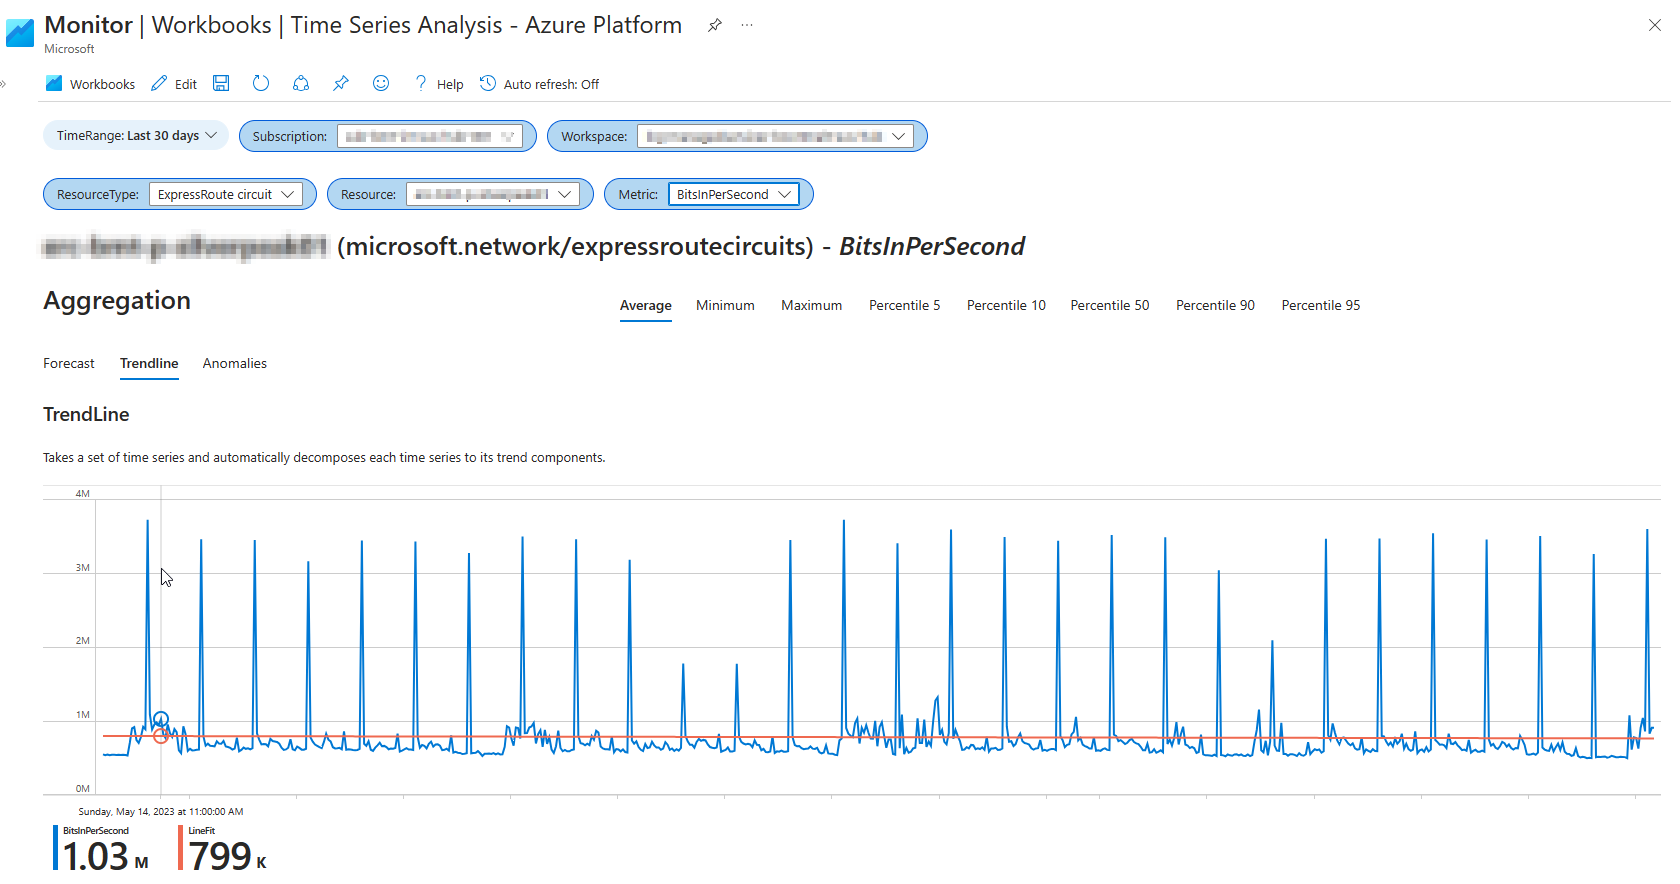
TRENDLINE

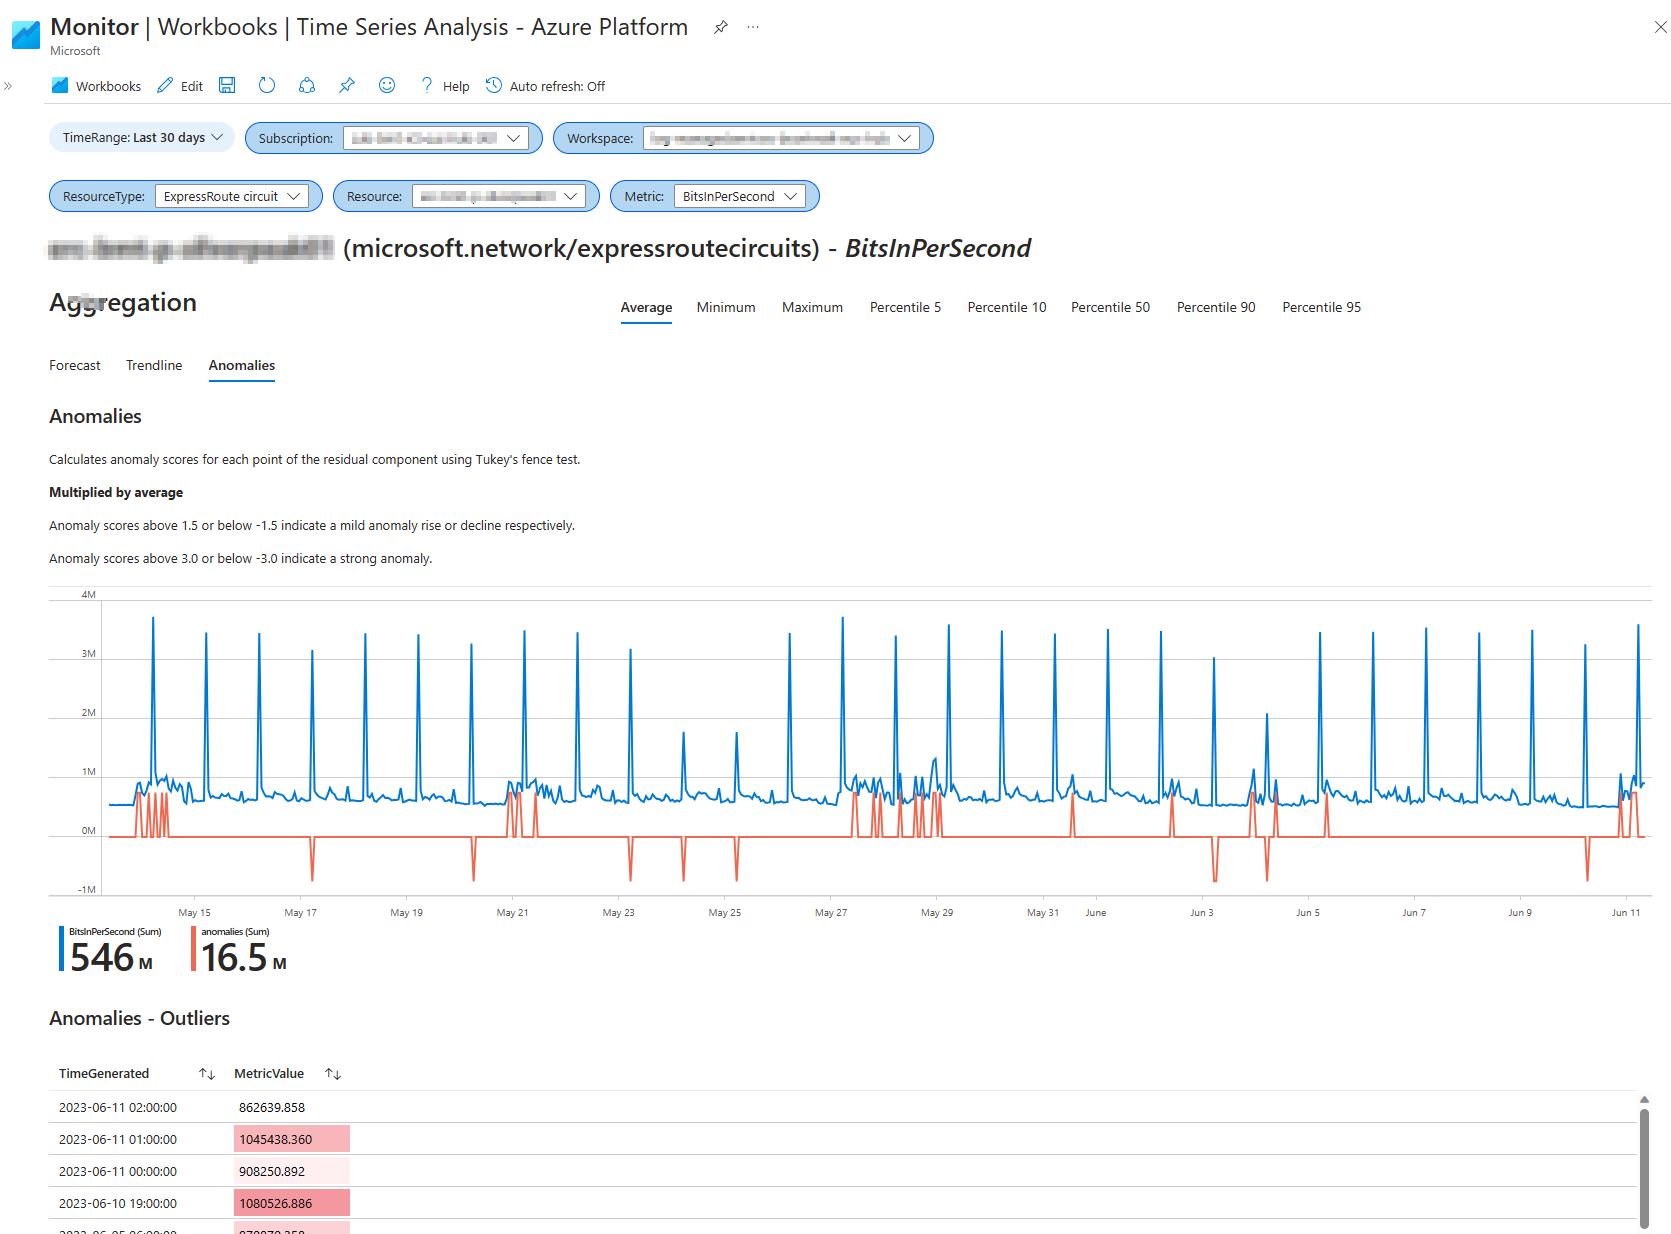
ANOMALIES
This is done using the series_decompose_anomalies() function.
I also added a table that extracts the outliers for the anomalies using the mv-expand operator on the timeseries.
Download
Here’s the ARM Template the Gallery Template.
Enjoy this blog? Read similar blogs here.
About the Author
As a Microsoft enthusiast I love their products and the vision they stand for.
Reference
Van de vyver, P., 2023, Kusto Time Series Analysis for Azure Resources – Workbook, Blog.philipvandenvyver.com, Available at: https://blog.philipvandevyver.com/2023/06/12/kusto-time-series-analysis-workbook/ [Accessed on 5 July 2023]