Get Answers from Reports Faster with SVG
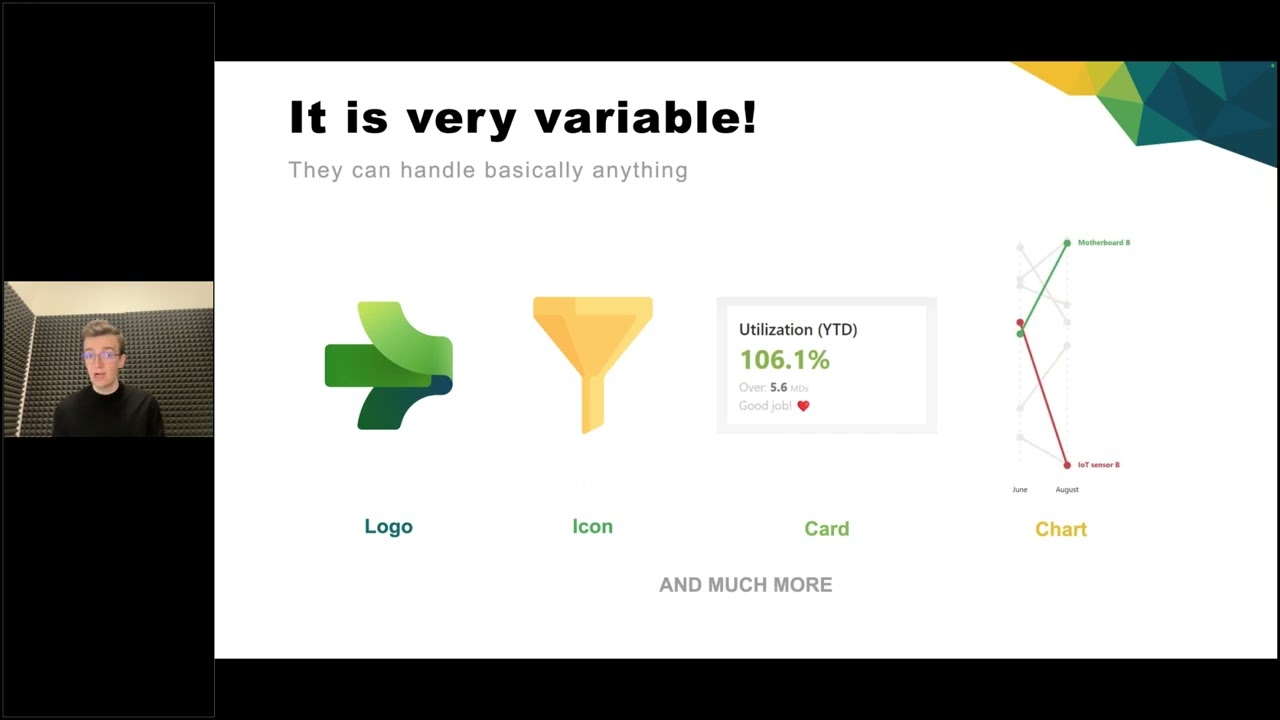
SVGs have been around for a very long time. However, their use in Power BI was minimal for a long time. However, their use is gradually being unlocked, and they can still be used in more and more places. We can even use them within the visuals to draw some detail that would be very difficult to create with classic visuals, or we would need many. Not all visuals still support them, though! Let’s look together at which visuals we can use in connection with SVG and how to use DAX to maintain our dynamic SVGs that can help reveal important information in the data and help convey important messages.
Benefits of this webinar:
SVGs are not only within the Power BI world but are used in all possible systems. During the lecture, we will explain that making them and even writing them yourself is not too difficult. Thanks to this, we can generate them using any language, which can render either directly SVG or at least HTML. But everything will be related to Power BI and its DAX language so that SVG can be generated with it and with them so that we can support user perception within the report and thus bring answers in the shortest possible time.
About the Speaker: Štěpán is a data lover, especially in the ecosystem of Microsoft tools. He primarily focuses on Power BI, Microsoft Fabric, Azure Synapse and Azure SQL. In general, he follows a very simple motto: Don´t say it cannot be done, or someone who doesn´t know it will come and do it.
Experience: Level 200/300
Audience: Developers, IT Pros, Data Viz
STAY UP TO DATE
Continue your learning and register for upcoming webinars here.
Catch up on the latest blogs, eBooks, webinars, and how-to videos.
Not a member? Check out our Learning Hub to unlock all content.
Subscribe to our YouTube channel for the latest community updates.