Introduction
A single number, such as total sales, market share year over year, or total opportunities, is sometimes the most important thing you want to track. A type of visualization in Power BI called a card might be the best way to view that number.
Steps of Create card visualizations
Step 1. Launch Microsoft Fabric https://app.fabric.microsoft.com/signin.
Step 2. Sign in (If you don’t have an account, create a trial version.
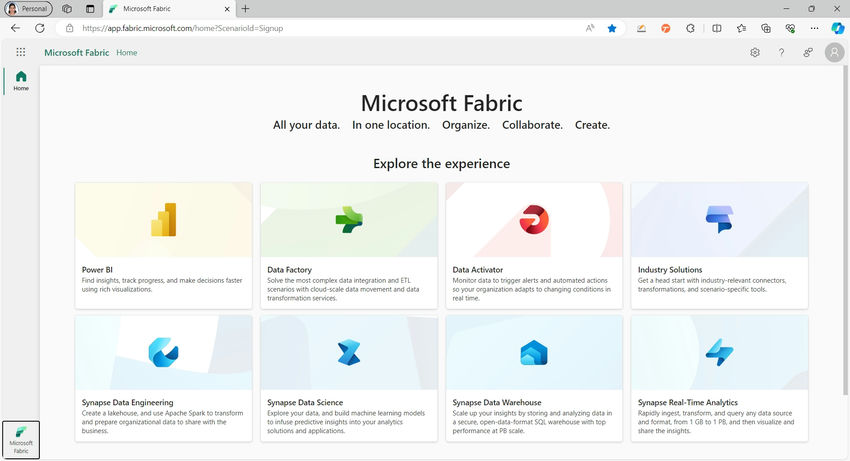
Step 3. Click Power BI.
Step 4. Connect the dataset.
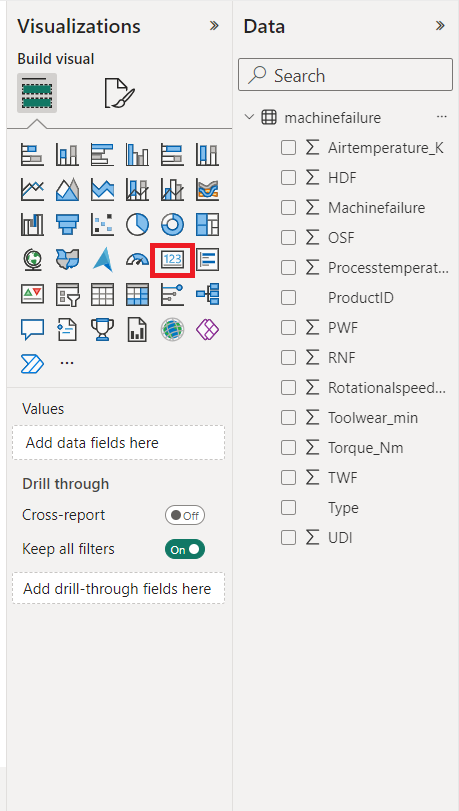
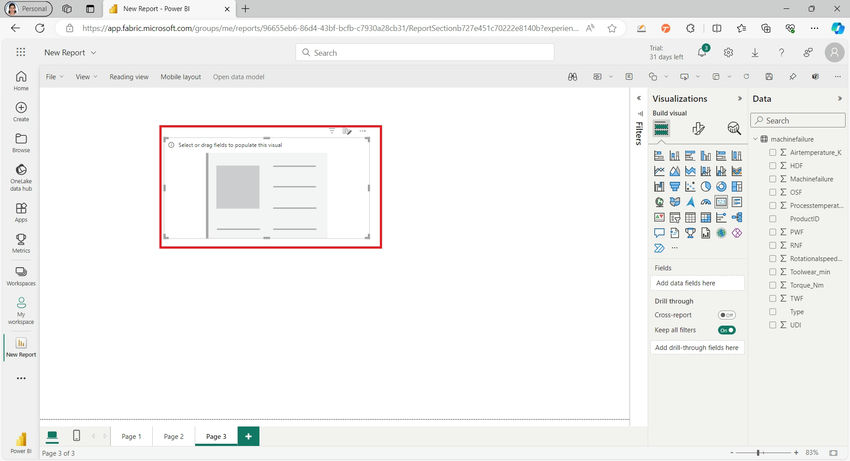
Step 5. Now, in the Visual pane, you can find the card visual as shown below.
Step 6. You can see the card visual added to the report.
Step 7. Select Any measure from the data pane as below.
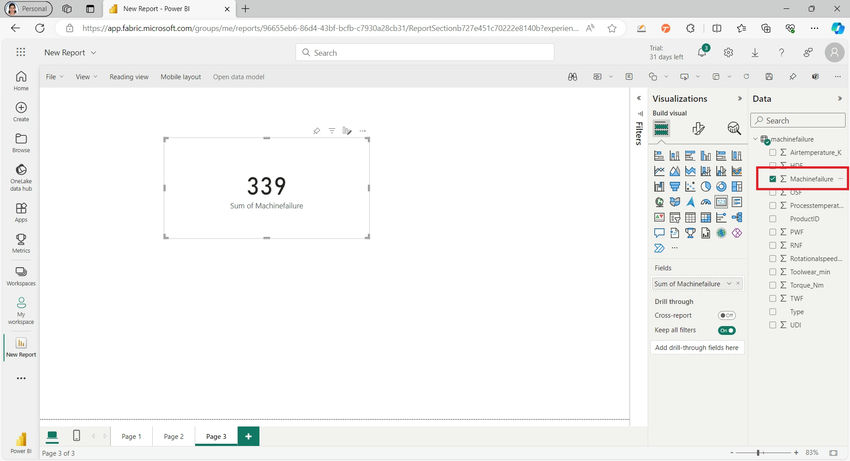
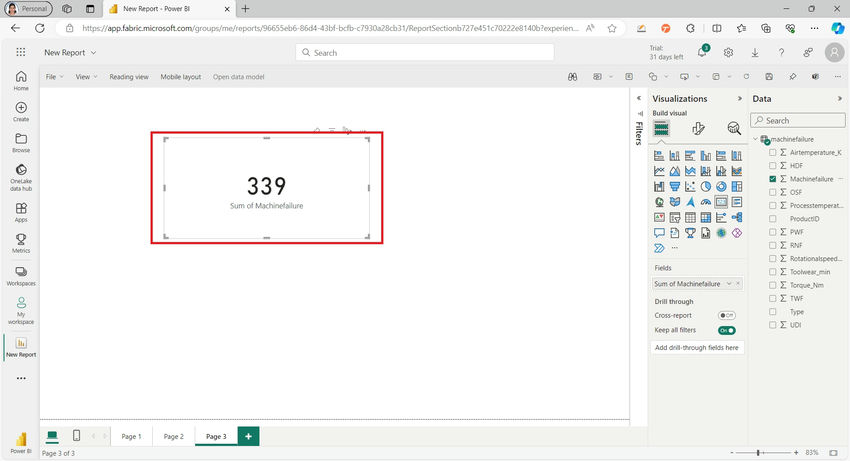
Step 8. You can find the KPI card visual.
Conclusion
The card is a helpful visual that presents important metrics such as total sales, profit growth, count of opportunities, and performance status.
About the Author:

With over 13 years of experience in academia and industry, Dr. Gomathi has distinguished herself as a skilled trainer and professor, specializing in Power App, Power BI, Business Central, Data Science, ETL tools, and Machine Learning.
Her accolades include several Asia Books of Record, India Books of Record, “Young Scientist” and “Women Scientist” awards, highlighting her contributions to the field of research and data analytics.
As a holder of 6 national and international patents, she continues to inspire and lead in the ever-evolving world of technology and analytics.
Reference:
Gomathi, S. (2024). Create Card Visualizations in Microsoft Fabric Power BI. Available at: https://www.c-sharpcorner.com/article/create-card-visualizations-in-microsoft-fabric-power-bi/ [Accessed: 22nd February 2024].